

Photo by Dmitry Demidko on Unsplash
- The XAU/USD pair fell near the 100-day SMA at around $1,960, but the pair ultimately held onto weekly gains.
- The US dollar continued to gain ground on Friday following solid Jobless Claims data.
- All eyes are on the FOMC decision next week.
At the end of the week, the XAU/USD pair traded near the 100-day Simple Moving Average of $1,962, experiencing a 0.30% decline. However, the pair nonetheless recorded a weekly gain, its third in a row.
The prevailing strength of the US dollar continued to exert downward pressure on XAU/USD. Notably, the recent release of Initial Jobless Claims data by the US Department of Labor revealed a lower figure of 228,000 people filing for unemployment benefits in the second week of July, below the market expectation of 242,000.
These positive employment figures reflect a robust US economy, potentially prompting the Federal Reserve to maintain a more aggressive stance. In that sense, the US bond yield rose sharply on Thursday, boosting the US dollar and applying the non-yielding metal selling pressure.
Ahead of next week’s Federal Open Market decision, markets have practically priced in a 25 basis point hike, and robust labor market data boosted the odds of an additional hike past July. However, those odds remain low, near 30%. In addition, Chair Powell’s words will be closely watched as investors look for clues regarding forwards guidance.
XAU/USD Levels to Watch
The daily chart of XAU/USD indicates a negative market sentiment that is dominated by bears. The Relative Strength Index (RSI) stands in positive territory above the midline but with a negative, while the Moving Average Convergence Divergence (MACD) displays fading green bars, signalling exhaustion for the bulls.
In the broader context, despite the bearish momentum, the price trading above the 20-, 100-, and 200-day Simple Moving Averages indicates that the overall trend continues to favor the bulls.
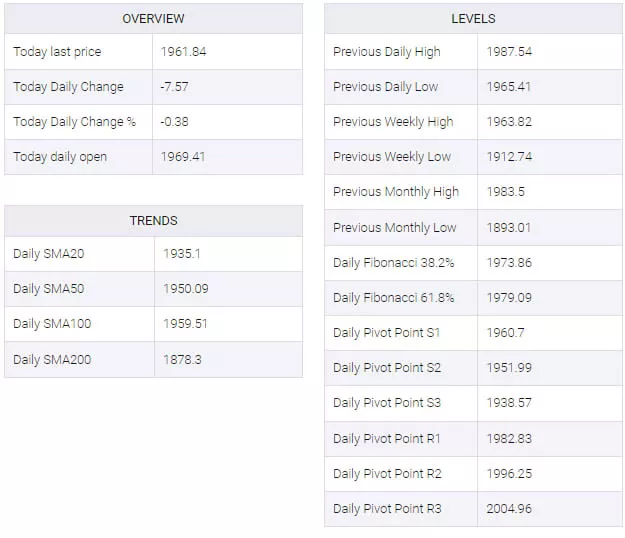
- Support levels: $1,960 (100-SMA), $1,950, $1,936 (20-day SMA).
- Resistance levels: $1,970, $1,987 (monthly high), $2,000.
XAU/USD Daily Chart
-638255725391681048.png)
XAU/USD Technical Levels
More By This Author:
USD/CHF Consolidates Around 0.8660 As Fed Policy Comes Under SpotlightUS Dollar Price Analysis: Bulls Eye A Run Towards 101.50s While In Bullish Territory
NZD/USD Aims To Recapture 0.6300 As PBOC Continues Dovish Stance


Comments
Log in or sign up to join the conversation.