

Image Source: Unsplash
- Despite seeing daily gains, the XAU/USD pair closed a third consecutive week of losses, near the $1,920 area.
- Declining yields amid soft PCE figures weakened the US dollar, therefore favoring gold prices.
On Friday, the gold spot XAU/USD pair traded with nearly 0.50% gains, jumping near the $1,920 area. Soft Personal Consumer Expenditures from the US fueled a decline in US yields and, thereby, a weaker US dollar, which in turn boosted the yellow metal. Moreover, gold’s short-term trajectory will be determined by bets on the next Federal Reserve decision, which will soon have an impact with crucial labor market data to be released next week.
The US Reported Soft PCE Figures - Eyes on Labor Market Data
The US Bureau of Economic Analysis recently showed that the Core Personal Consumption Expenditures (PCE), the Federal Reserve's preferred measure of inflation, unexpectedly decelerated to 4.6% year-over-year in May.
As attention shifts to labor market data, investors are trying to decipher the next moves by the Fed after Chair Powell commented that the Federal Open Market Committee (FOMC) foresee additional hikes, driven by a hot labor market.
In that sense, Non-farm payrolls (NFP) are expected to decline to 200,000 in June. In addition, many foresee Average Hourly Earnings to remain steady at 4.3% year-over-year while the Unemployment rate rests at 3.7%.
As for now, markets are discounting a 25 basis points hike in the next Fed meeting in July, but many disagree when exactly the second hike Jerome Powell hinted at will come. It is worth noting that non-yielding yellow metals tend to be negatively correlated with interest rates, so hawkish bets on the Fed would apply further selling pressure.
XAU/USD Levels to Watch
The technical outlook, according to the daily chart, remains neutral to bearish for the short-term. The Relative Strength Index (RSI) held below its midline but with a positive slope, while the Moving Average Convergence Divergence (MACD) printed rising red bars.
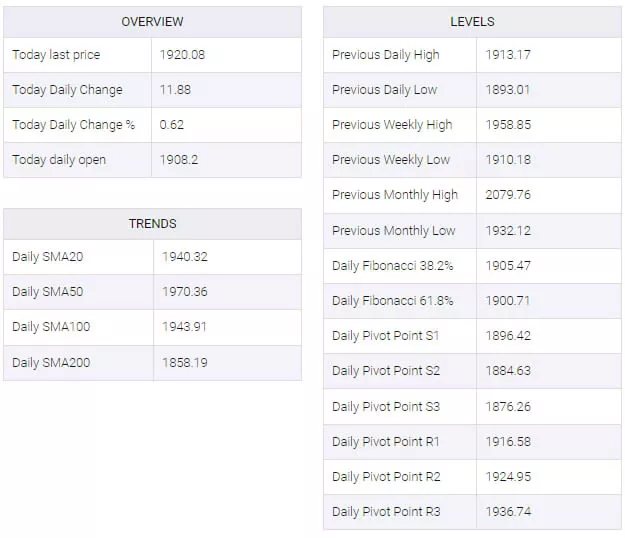
- Support levels to watch: $1,905, $1,900, $1,890.
- Resistances levels to watch: $1,930, $1,938 (20-day Simple Moving Average), $1,945 (100-day Simple Moving Average).
XAU/USD Daily Chart
-638237573946047023.png)
XAU/USD Technical Levels
More By This Author:
Dow Jones Industrial Average Recap: DJIA Ramps Up Gains On Friday
US Dollar Steady As Traders Keep Powder Dry For US PCE Data
AUD/USD Stick To Modest Gains Above 0.6600, Upsides Remains Capped Ahead Of Key US Data


Comments
Log in or sign up to join the conversation.