

Photo by Dmitry Demidko on Unsplash
- XAU/USD closed the week with a 1% weekly decline above the convergence of the 20-day and 200-day SMAs.
- US yields appeared set to close a 2% weekly increase.
- Attention shifts to next week’s US CPI and Retail Sales from the US.
At the end of the week, the XAU/USD traded with mild losses, closing the week at around $1,918. Precious metal closed the week with sharp losses of around 5% for silver and nearly 1% for gold. These losses were driven by US yields edging higher on the back of growing tightening expectations for the Federal Reserve.
Precious metals tend to be seen as the opportunity cost of holding non-yielding metals, and the US Treasury yields consolidated their weekly rallies on Friday. The 2-year yield stood at 4.99%, while the 5-year and 10-year rates were seen at 4.40% and 4.26%, respectively. All three saw mild gains during the session, which limited gold’s advances on the day.
For next week, investors eagerly await the Consumer Price Index (CPI) and Retail Sales figures from August in the US, and investors seems set to continue placing their bets on the next Federal Reserve decision. As for now, markets expect a 25 basis point (bps) hike for the rest of the year, but they aren’t certain if it will arrive in November or December. The incoming US data will help investors to model their expectations.
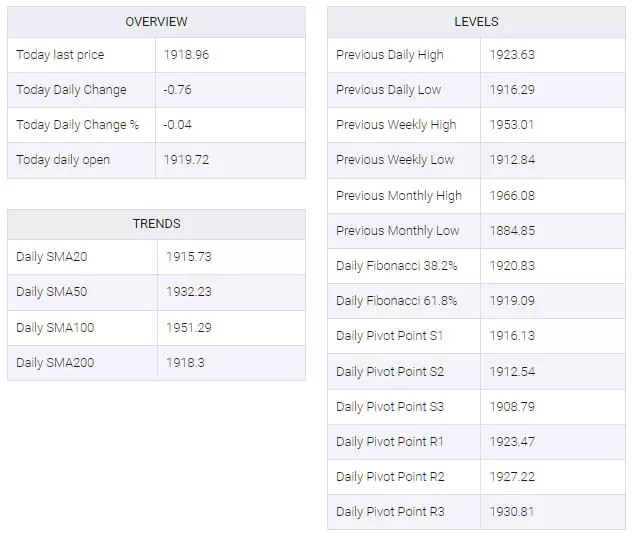
XAU/USD Levels to Watch
The technical outlook for the XAU/USD appears to be neutral to bearish for the short-term, with indicators turning flat in negative territory. The neutral slope of the Relative Strength Index (RSI) below 50 further reinforces this mixed sentiment, as does the MACD, which displays stagnant red bars.
On the other hand, the previous metal has been battling to consolidate above the convergence of the 20-day and 200-day Simple Moving Averages (SMA). For now, in the larger context, the bulls appear to be in command.
- Support levels are as follows: $1,915 (20 and 200-day SMA convergence), $1,900, $1,880.
- Resistance levels are as follows: $1,930, $1,950 (100-day SMA), $1,970.
XAU/USD Daily Chart
-638298064845534709.png)
XAU/USD Technical Levels
More By This Author:
Silver Price Forecast: XAG/USD Displays Volatility Contraction Near $23
USD/CAD Price Analysis: Defends 1.3650 Resistance-turned-support Ahead Of Canadian Jobs Data
EUR/GBP On The Top End For The Week, 0.8580, The Level To Overcome


Comments
Log in or sign up to join the conversation.