

Photo by Dmitry Demidko on Unsplash
- Spot gold prices saw further downside on Friday as investors pivoted on Fed remarks.
- The Fed appeared to be more hawkish than market participants believed last week.
- The US dollar and US Treasury yields saw gains for the week while gold swooned.
XAU/USD prices were seen testing towards the downside on Friday, edging towards the $1,930 mark after hawkish comments from Federal Reserve Chairman Jerome Powell, who suggested that the Fed may not have achieved suitably restrictive monetary policy to contain inflation.
Alongside Fed head Powell, several Fed policymakers hit newswires this week suggesting that rates may not be high enough to sufficiently cap inflation towards the Fed's 2% target. The hawkish stance completely eviscerated the broad-market narrative that the Fed was not only done with rate hikes, but would be heading into a rate-cut cycle soon.
Investors heralded the end of the Fed's rate hike cycle following a worse-than-expected US Nonfarm Payrolls print last Friday, but Fed officials have spent the week warning that a single bad labor data reading is not enough to shift the dot plot.
Up Next: US CPI Inflation Data to Balance Fed Statements
Next week's US Consumer Price Index inflation reading will carry extra weight on Tuesday, as investors peel back the layers to see if inflation will cool enough to resume hoping for future rate cuts to ease borrowing costs.
US CPI inflation figures are expected to soften month-on-month, with the headline October print forecast to decline from 0.4% to 0.1%, while the annualized Core CPI for the year into October is expected to hold steady at 4.1%.
A meet-or-beat print for annualized Core CPI would mean US inflation is still running over twice as hot as the Fed's target of 2% annually.
XAU/USD Technical Outlook
Spot gold's declines on Friday accelerated the price action into bear country, as the yellow metal witnessed a rejection from the 50-hour simple moving average (SMA) from $1,965. XAU/USD closed entirely bearish for the week with little relief bidding, seeing a rejection from the 200-hour SMA early Monday and declining nearly 3% on the week.
On the daily candlesticks, XAU/USD slumped back into the 200-day SMA as gold bid back into long-term median prices. A constraining 50-day SMA on the bearish side of the longer moving average may imply that further downside could be in the cards.
XAU/USD Hourly Chart
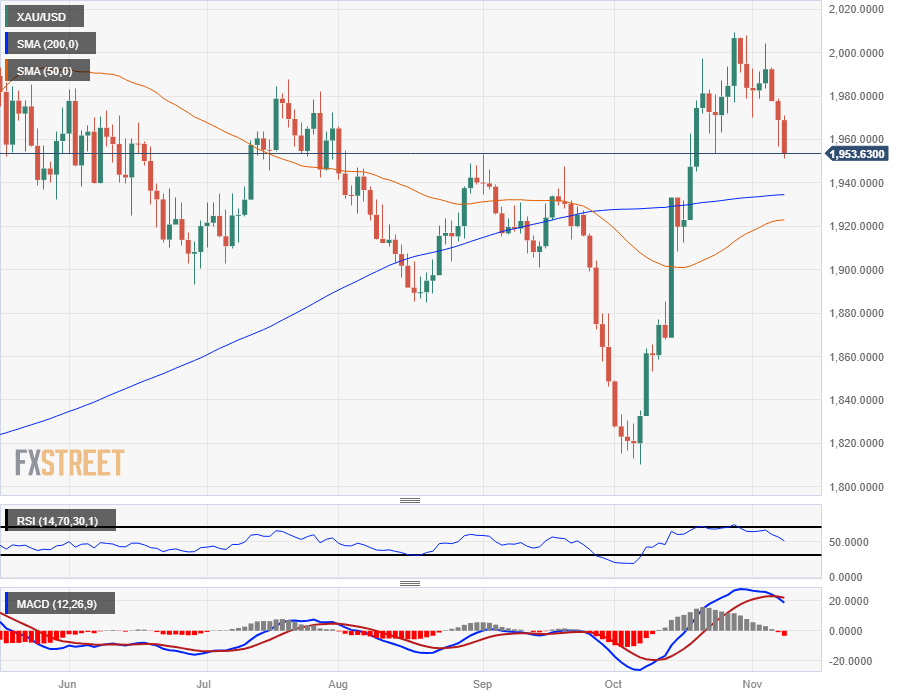
(Click on image to enlarge)
XAU/USD Daily Chart
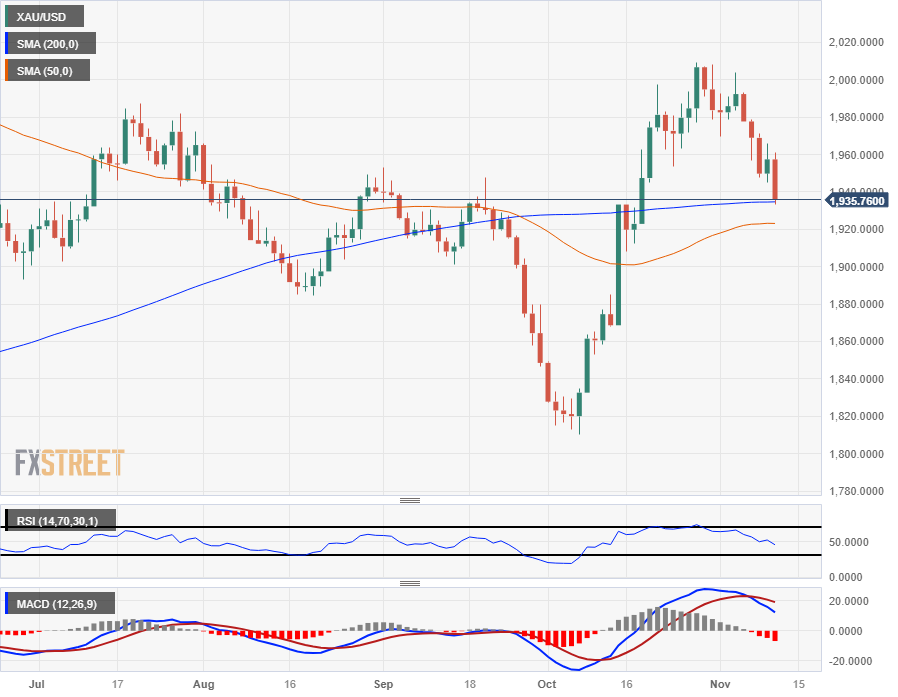
(Click on image to enlarge)
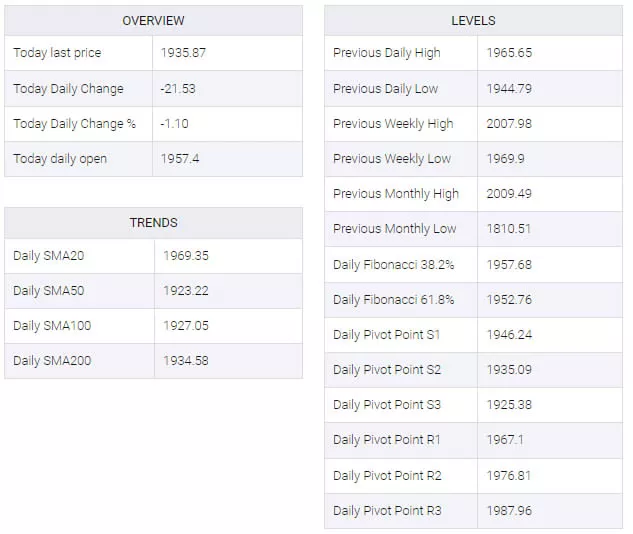
XAU/USD Technical Levels
More By This Author:
Crude Oil Looking To Firm Up A Bounce From $76US Dollar Rallies As Powell Delivers Harsh Warning On Rate Hikes
EUR/USD Attempts To Recover Recent Losses, Hovers Around 1.0670


Comments
Log in or sign up to join the conversation.