
Gold Is Knocking On A Key Breakout Level
(Click on image to enlarge)
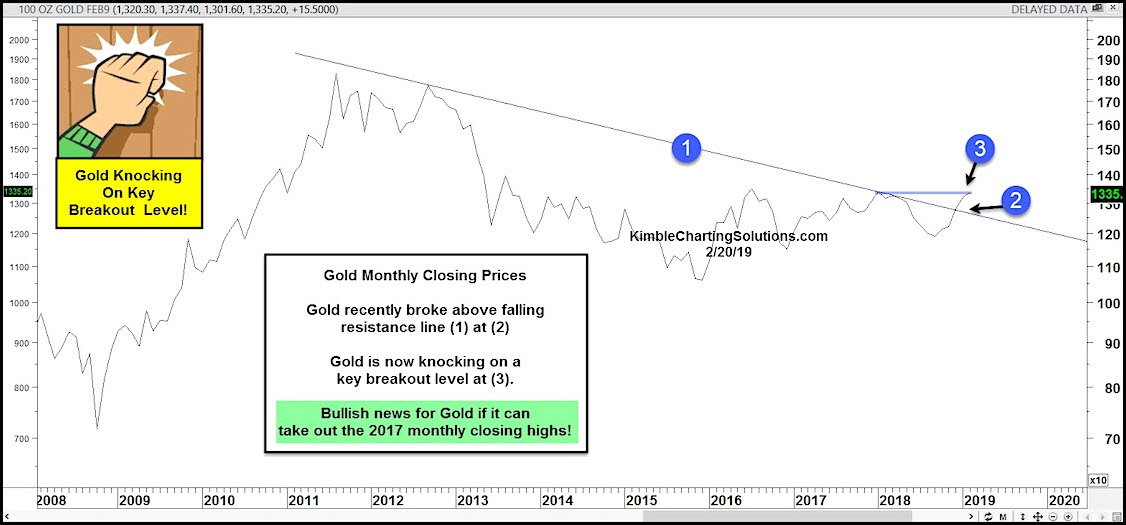
For the past 5 years, Gold prices have traded sideways. There were plenty of “trades” to be made, but that type of price action tends to grind out long-term bulls and bears.
You can see this in today’s “monthly” closing chart for Gold (shown below).
Gold bulls caught a break recently when Gold broke out above its multi-year downtrend line at (1) and (2). This spurred a big advance in metals & mining stocks.
Can Gold bugs and bulls keep the momentum going? We should find out shortly.
Gold is currently knocking on a key breakout resistance level (3). A bullish message will be sent to bulls if Gold can breakout above the 2017 monthly closing highs!
Sign up for Chris's Kimble Charting Solutions' email alerts--click here.
How did you like this article? Let us know so we can better customize your reading experience.

Comments
 No Thumbs up yet!

