
As expected, gold has turned in a fairly strong start to the month. It’s below April but is still early in the contract.
(Click on image to enlarge)
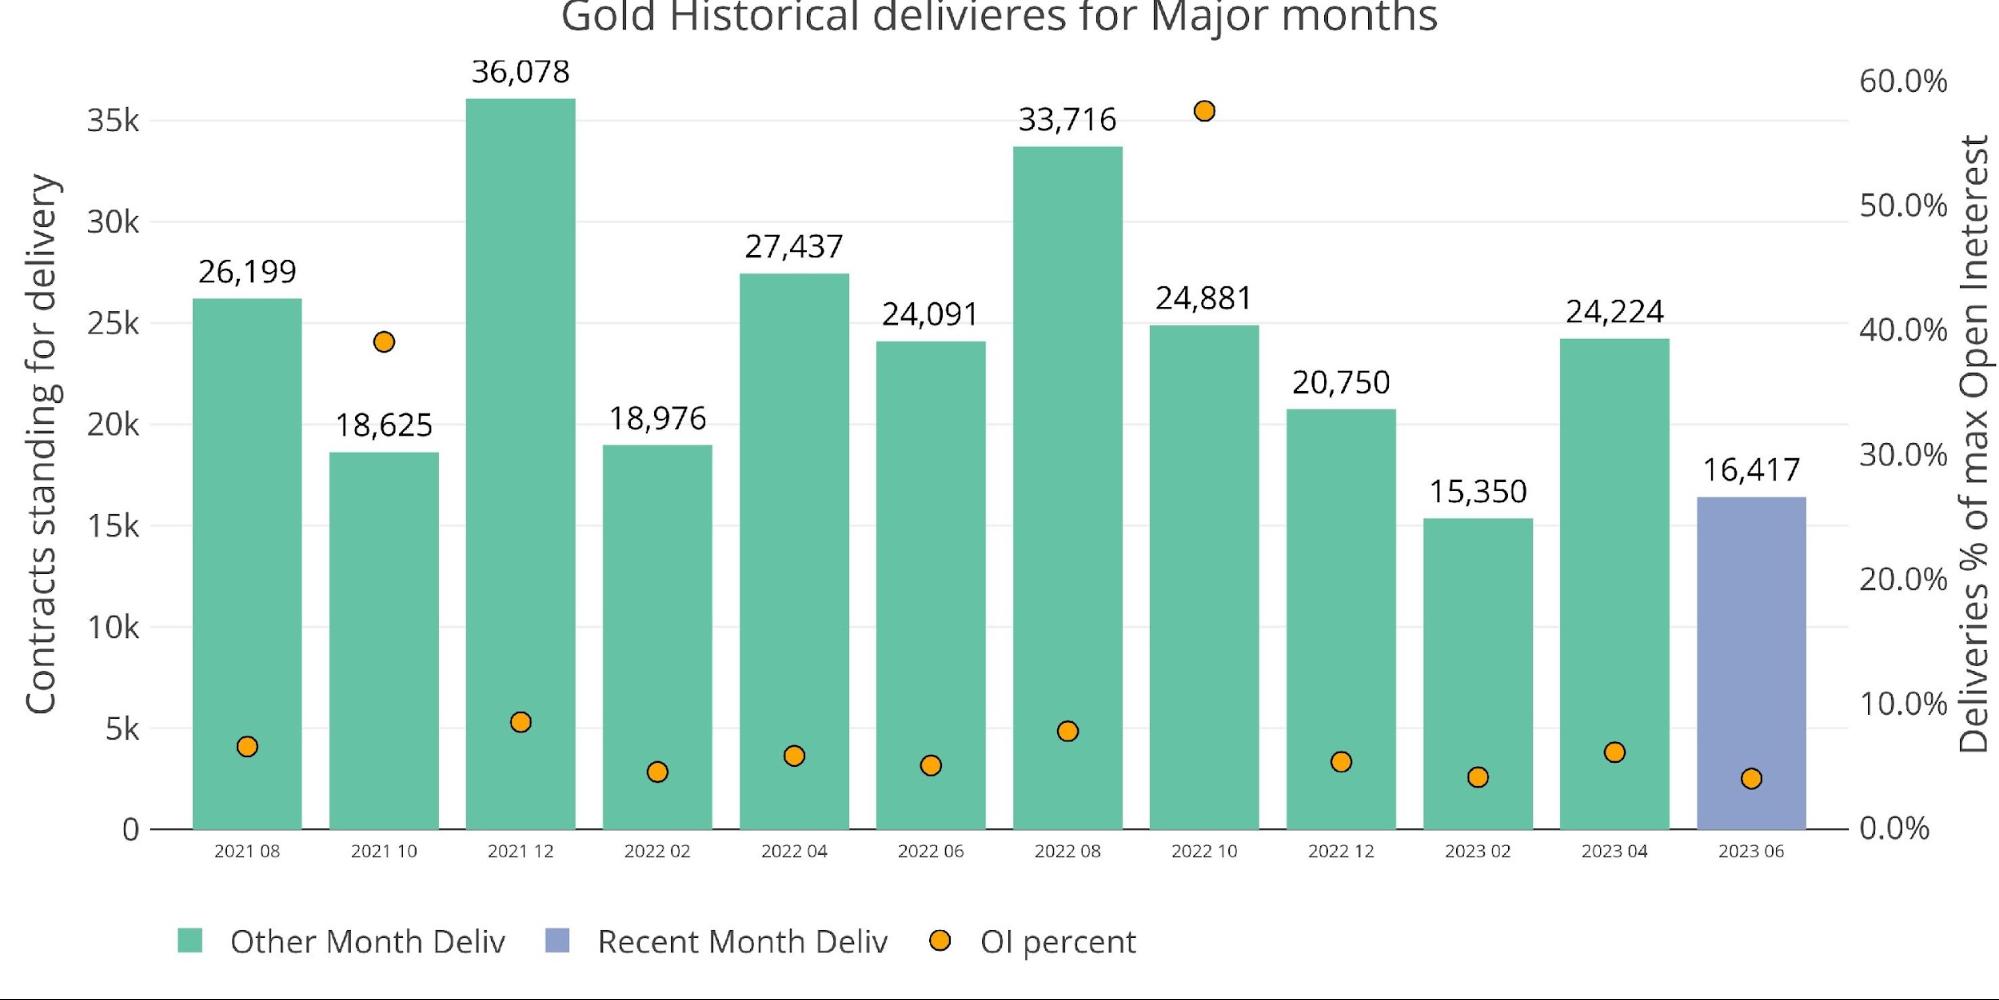
Figure: 1 Recent like-month delivery volume
As shown below, the amount on First Position was actually the highest since last August which should lead to high delivery volumes.
(Click on image to enlarge)
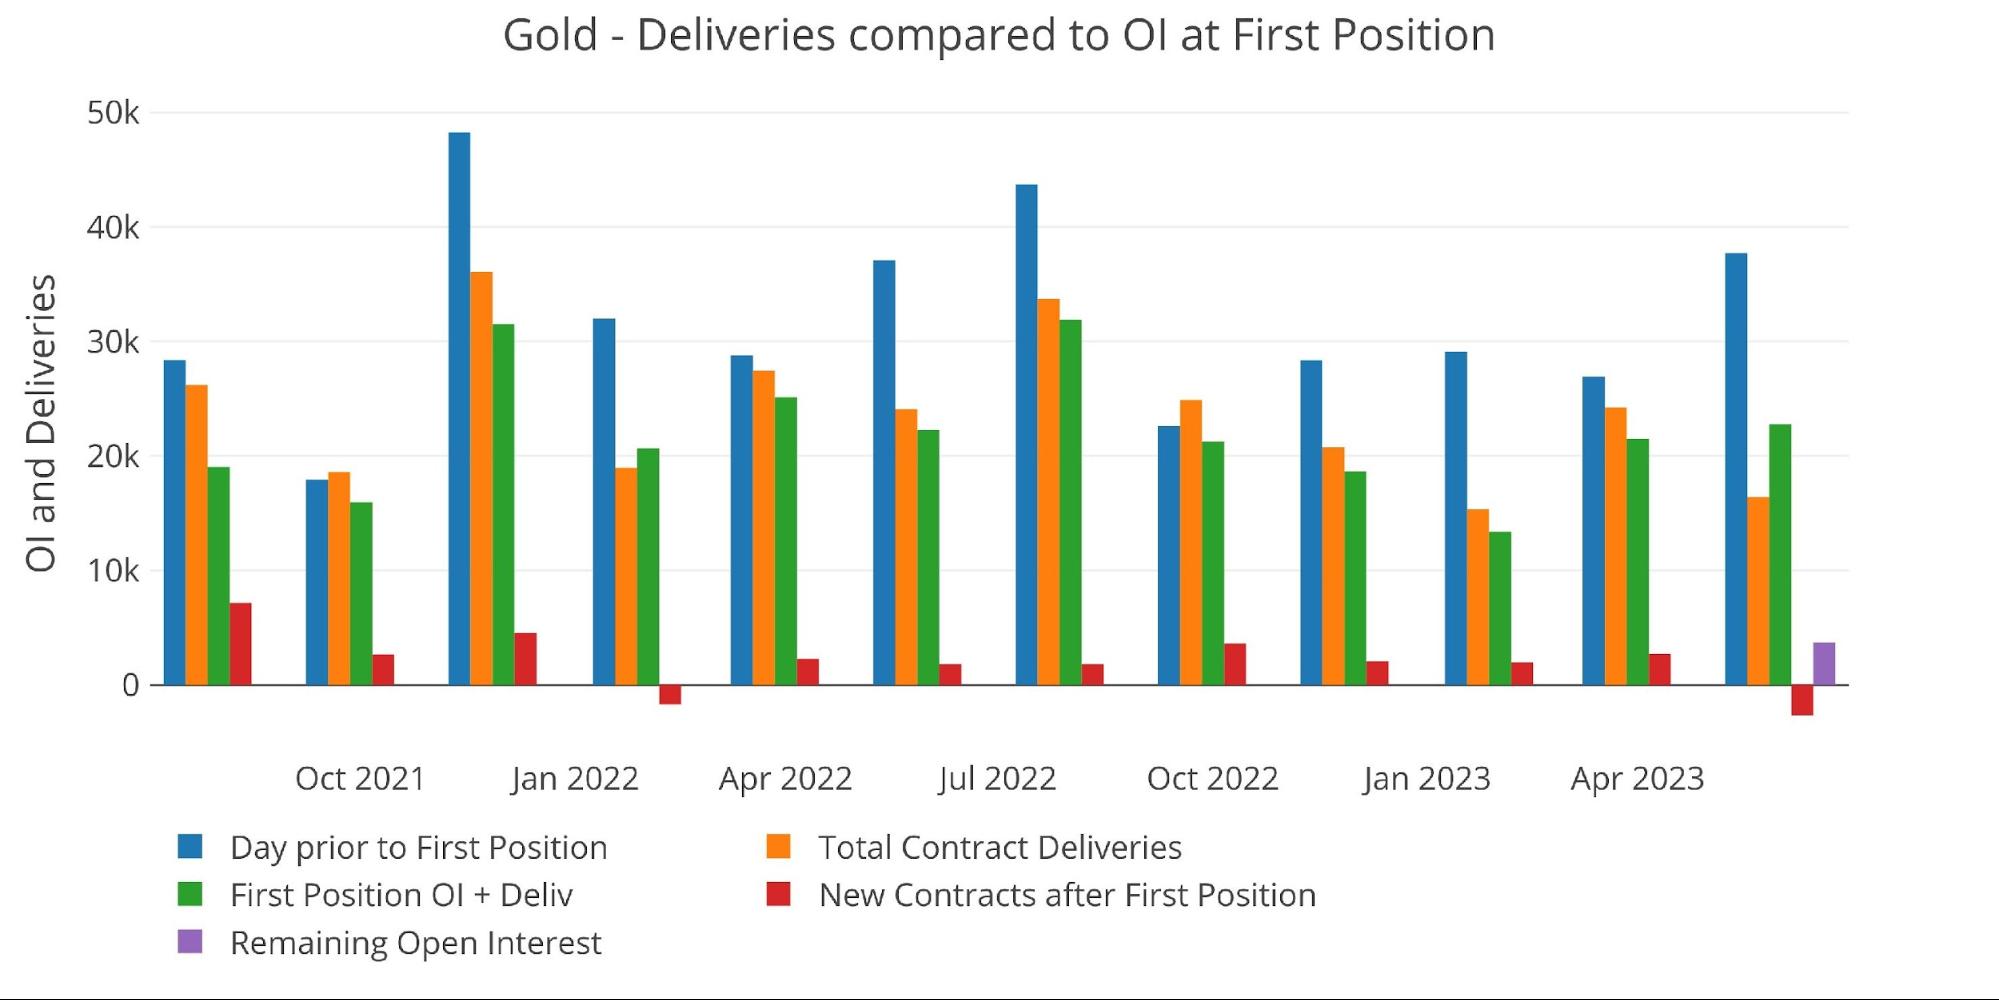
Figure: 2 24-month delivery and first notice
One factor that can drive total delivery volume is mid-month activity. Historically, this has been a tailwind for greater delivery volume. This month, it has started as a headwind. So far, the number of contracts that have cash settled has reached a new record.
See red line below. On the first day alone, over 2600 contracts cash settled. The next highest day was last December when 1373 cash settled. Why have so many contracts cash settled? Most likely because it’s getting harder to deliver physical metal. Ironically, this is also the opposite of what happened last month. But that was a minor month and most likely driven by BofA… potentially in an effort to prepare for the June delivery month (more on this below).
Keep in mind also, these contracts could have rolled the day before but decided not to. These contracts held on for delivery and then immediately cash settled.
(Click on image to enlarge)
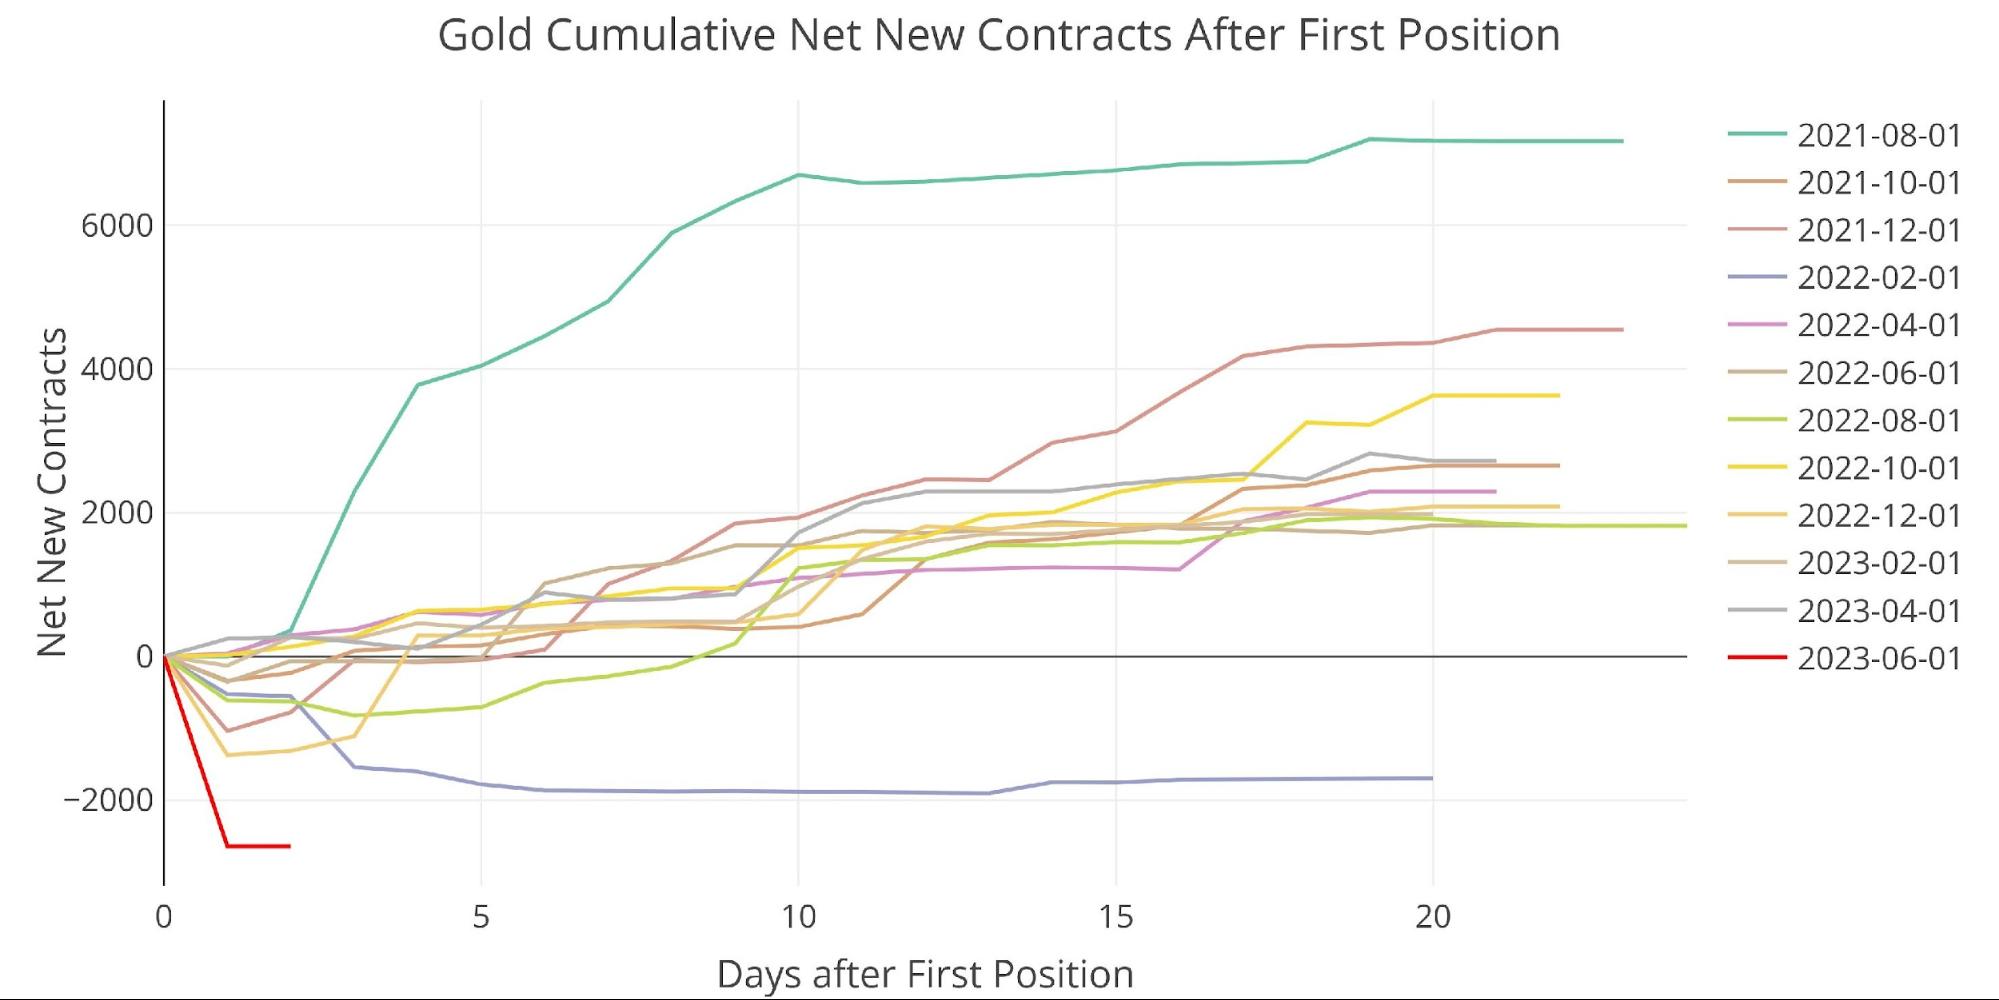
Figure: 3 Cumulative Net New Contracts
Even with the cash settlement, there are still 3700 contracts remaining of open interest. This is roughly $740M which will bring this year close to the last two years from a notional delivery perspective. Without the cash settlement, this would have been the biggest June since the blowout delivery volume in 2020.
(Click on image to enlarge)
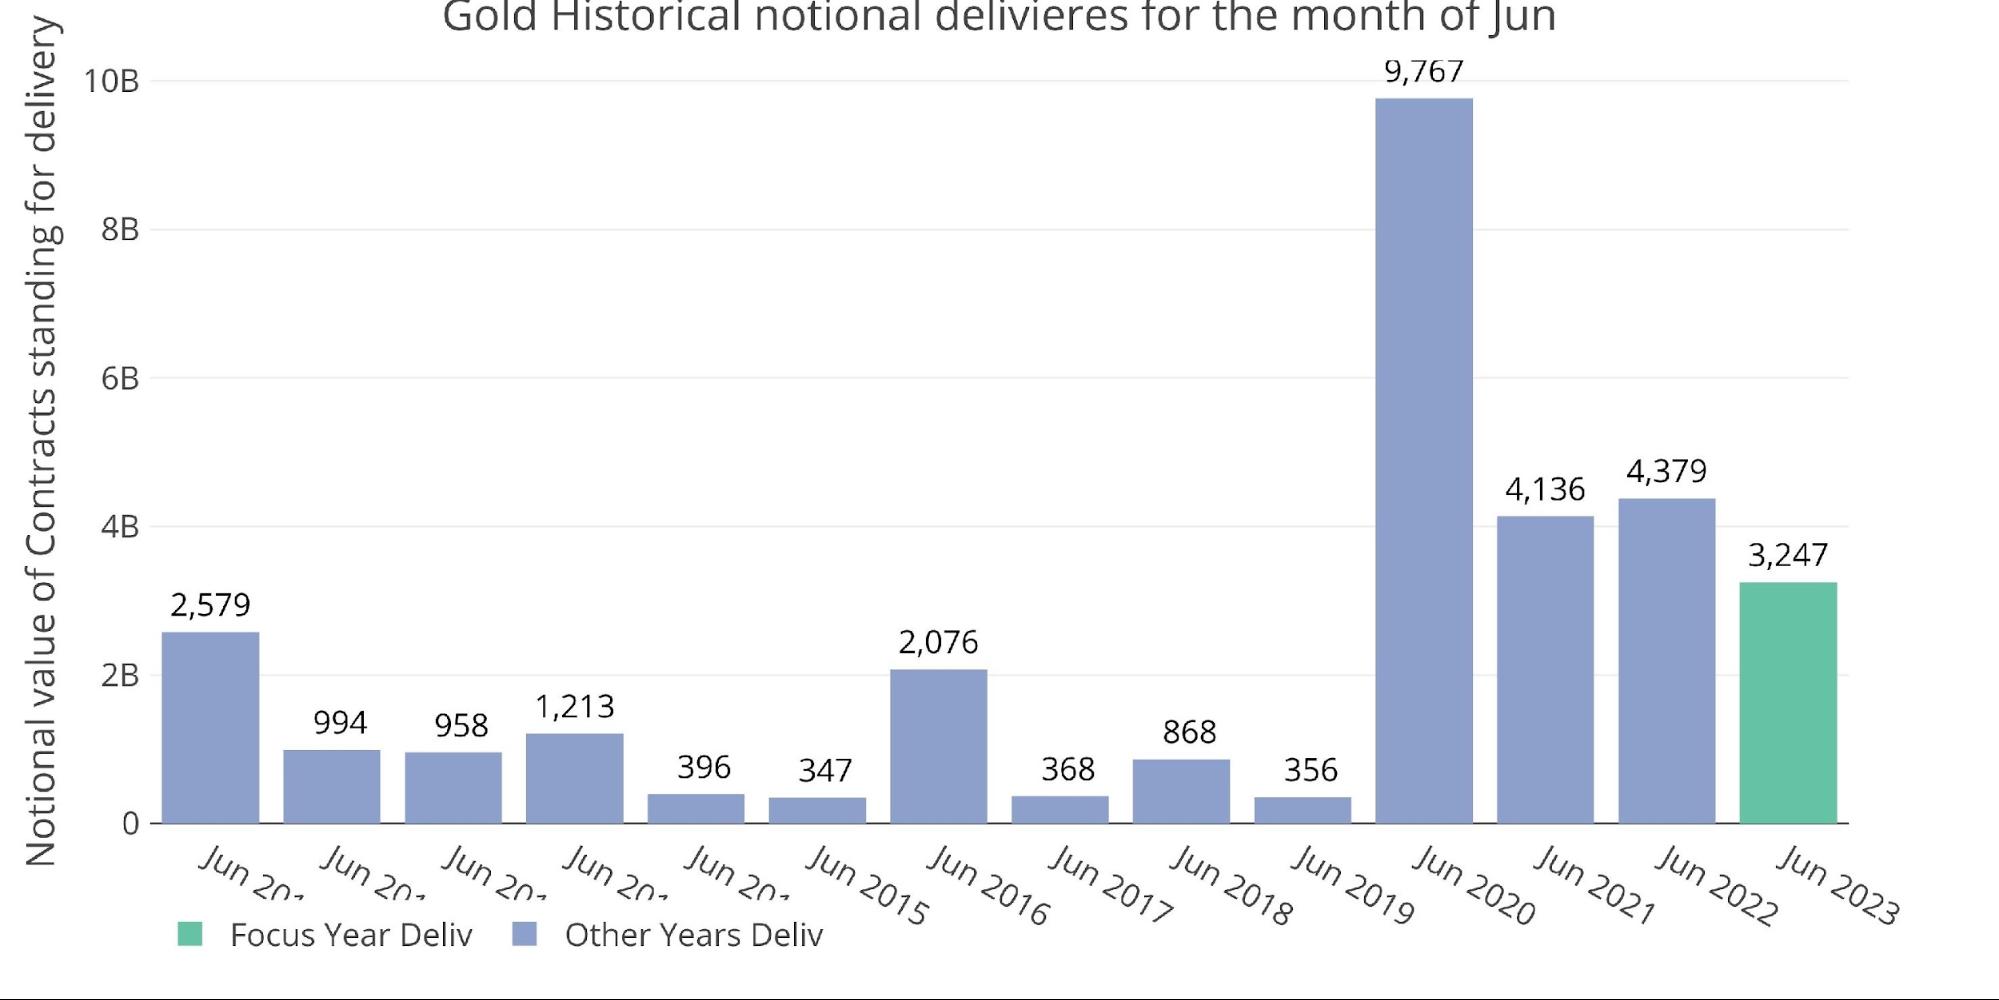
Figure: 4 Notional Deliveries
The House account activity shows more stress in the market. BofA has had to step up and deliver a huge chunk of gold (5k contracts). Starting in 2021, BofA has become much more active and seems to be serving as a backstop to the physical market. Accumulating metal in quieter periods and then delivering out when the market comes under stress.
As mentioned above, BofA was accumulating metal last month (when the price was higher) and the five months prior, only to deliver a large amount this month. Seems strange…
(Click on image to enlarge)
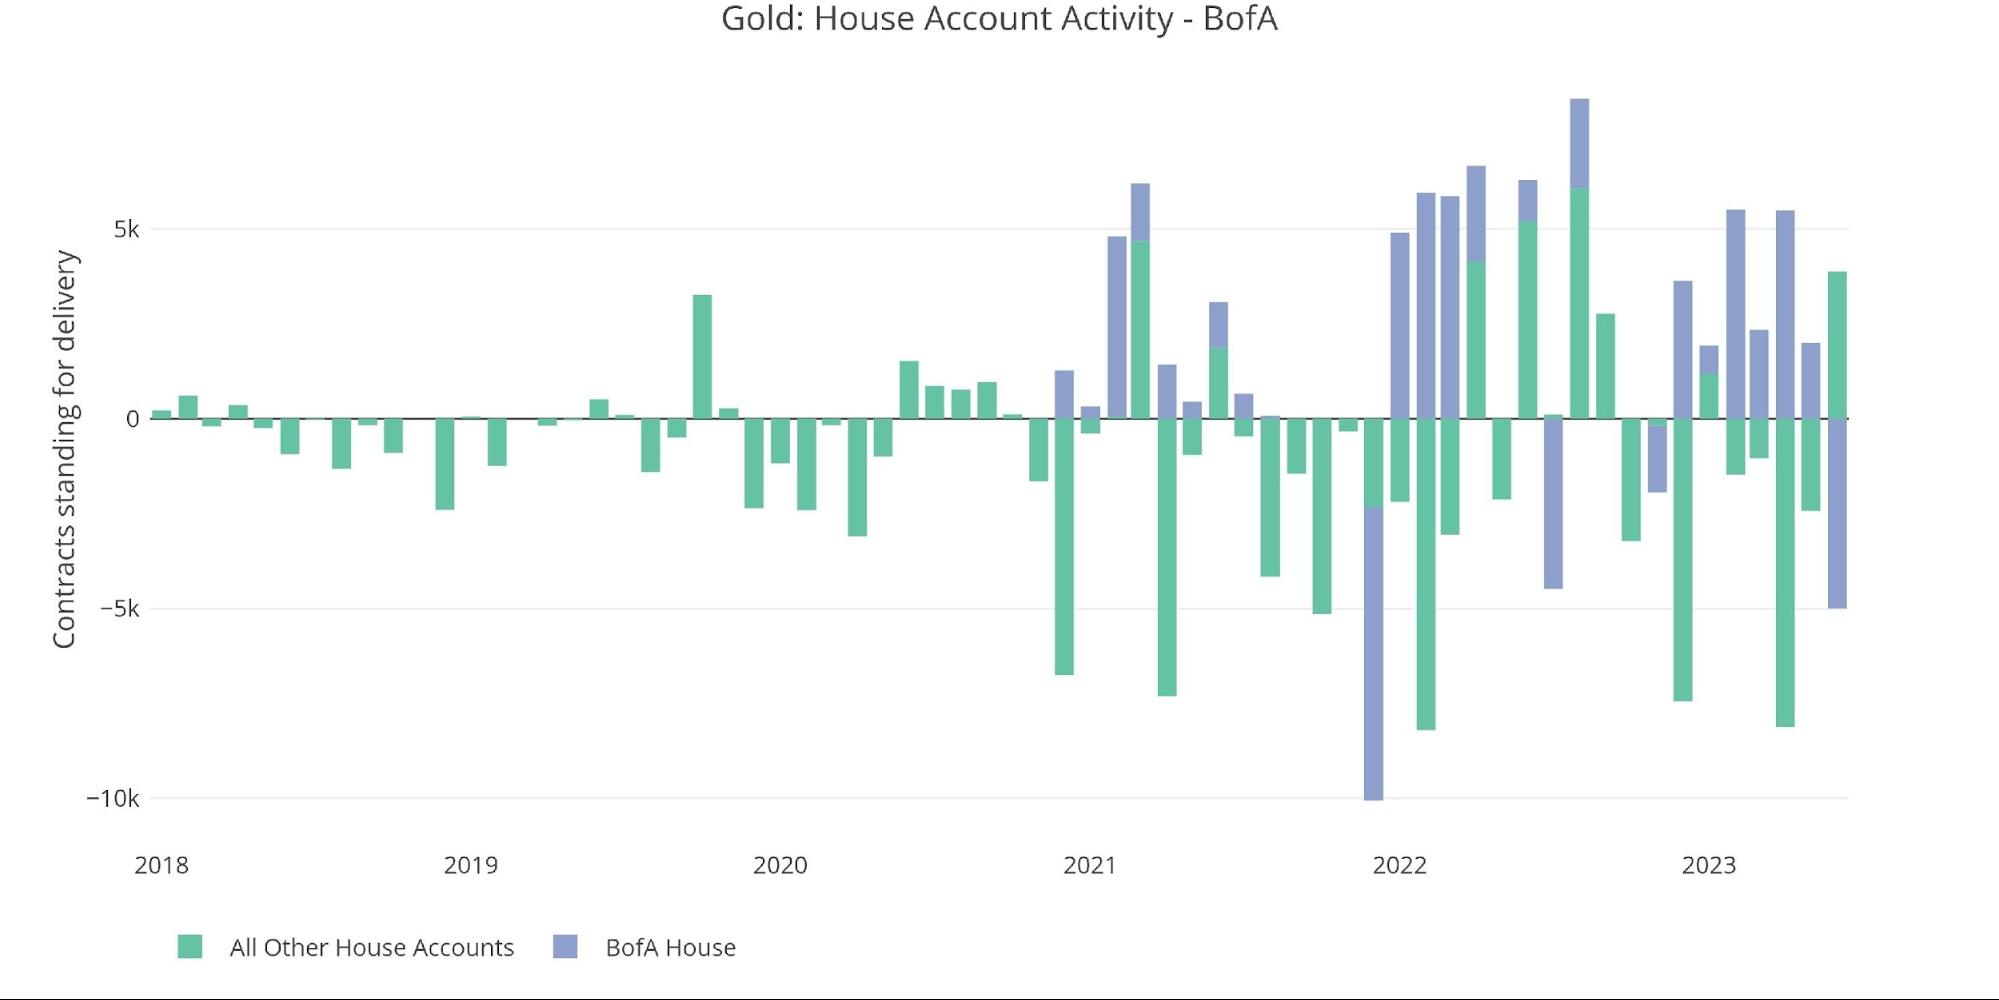
Figure: 5 House Account Activity
The physical inventory continues to demonstrate erratic behavior as well. In the last few days, metal actually moved out of Registered. This means as the delivery window approached, vaults reduced the amount of metal available for delivery. This could have been a factor driving cash settlement.
The theory is that right before the delivery period started, the available delivery supply dropped, prompting the need for cash settlement. As discussed many times, I believe the actual metal available for delivery is much smaller than what is displayed on the daily stocks report.
(Click on image to enlarge)
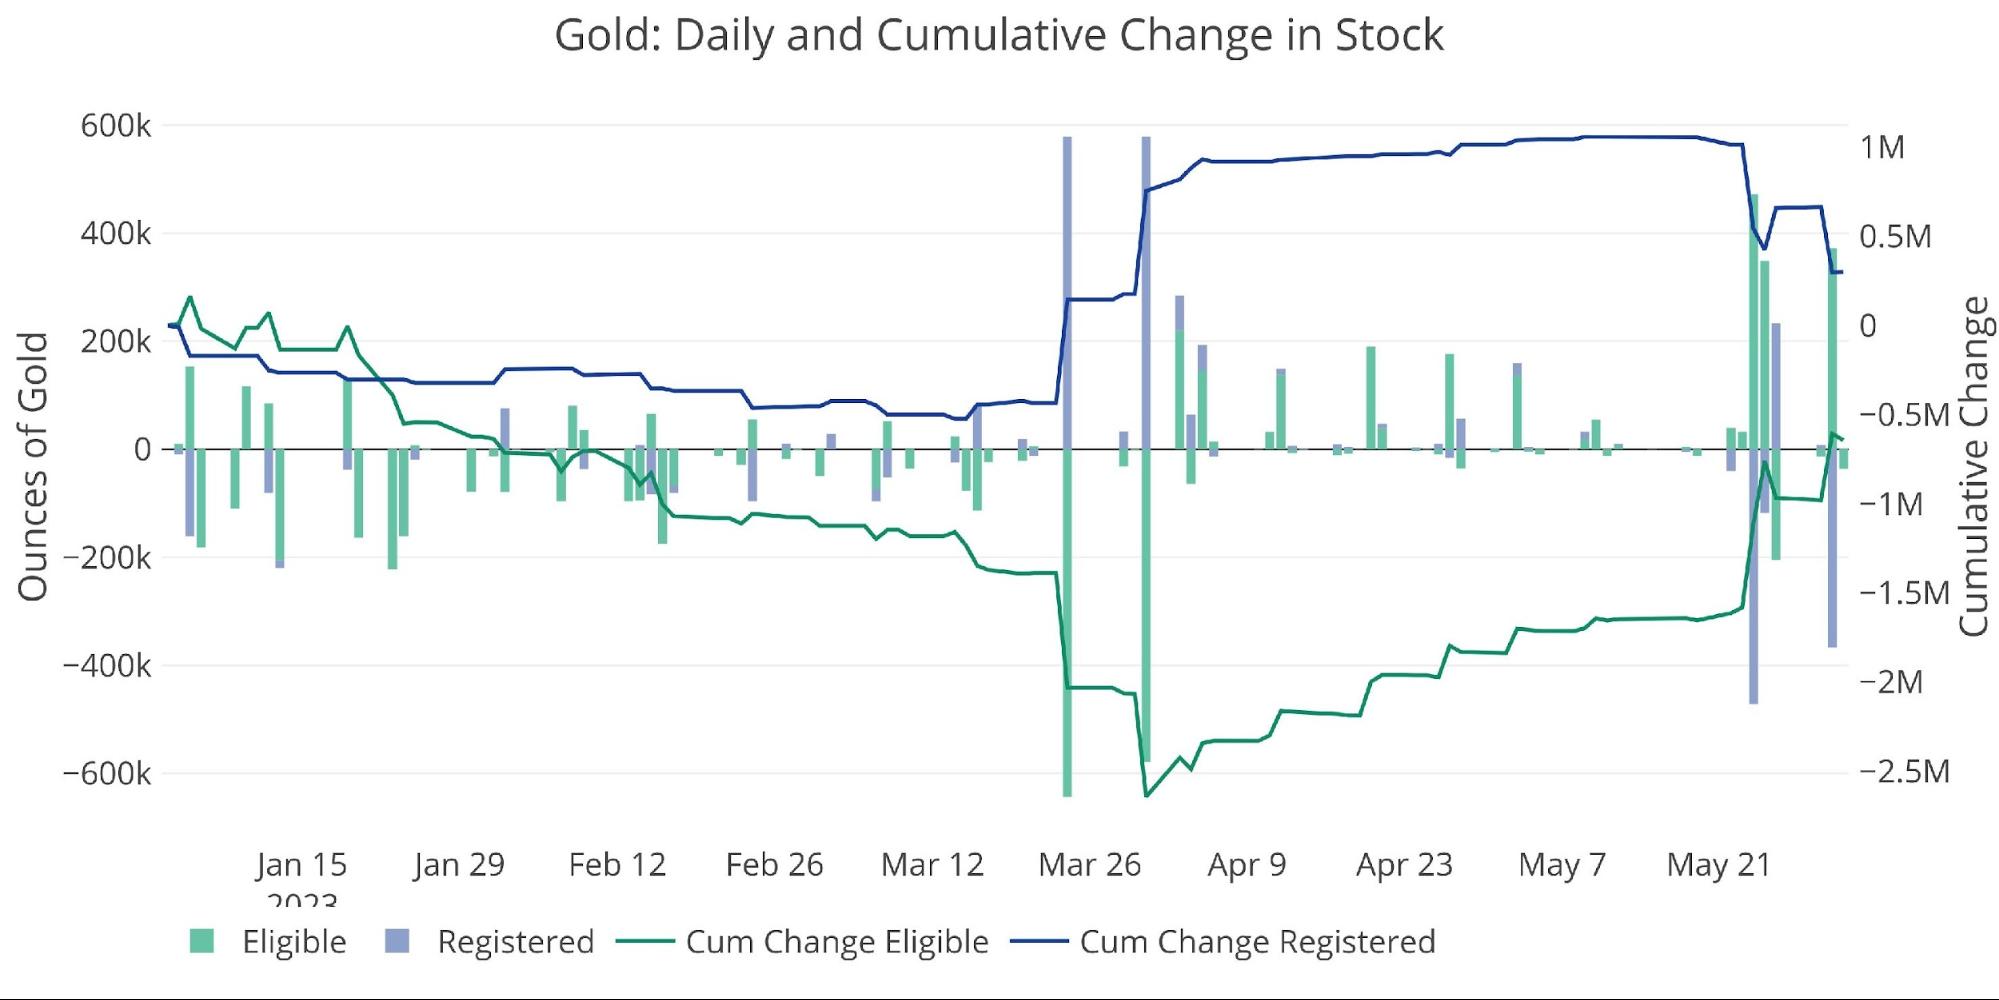
Figure: 6 Recent Monthly Stock Change
Gold: Next Delivery Month
Looking ahead to July shows gold slightly ahead of the average for the same time of the month.
(Click on image to enlarge)
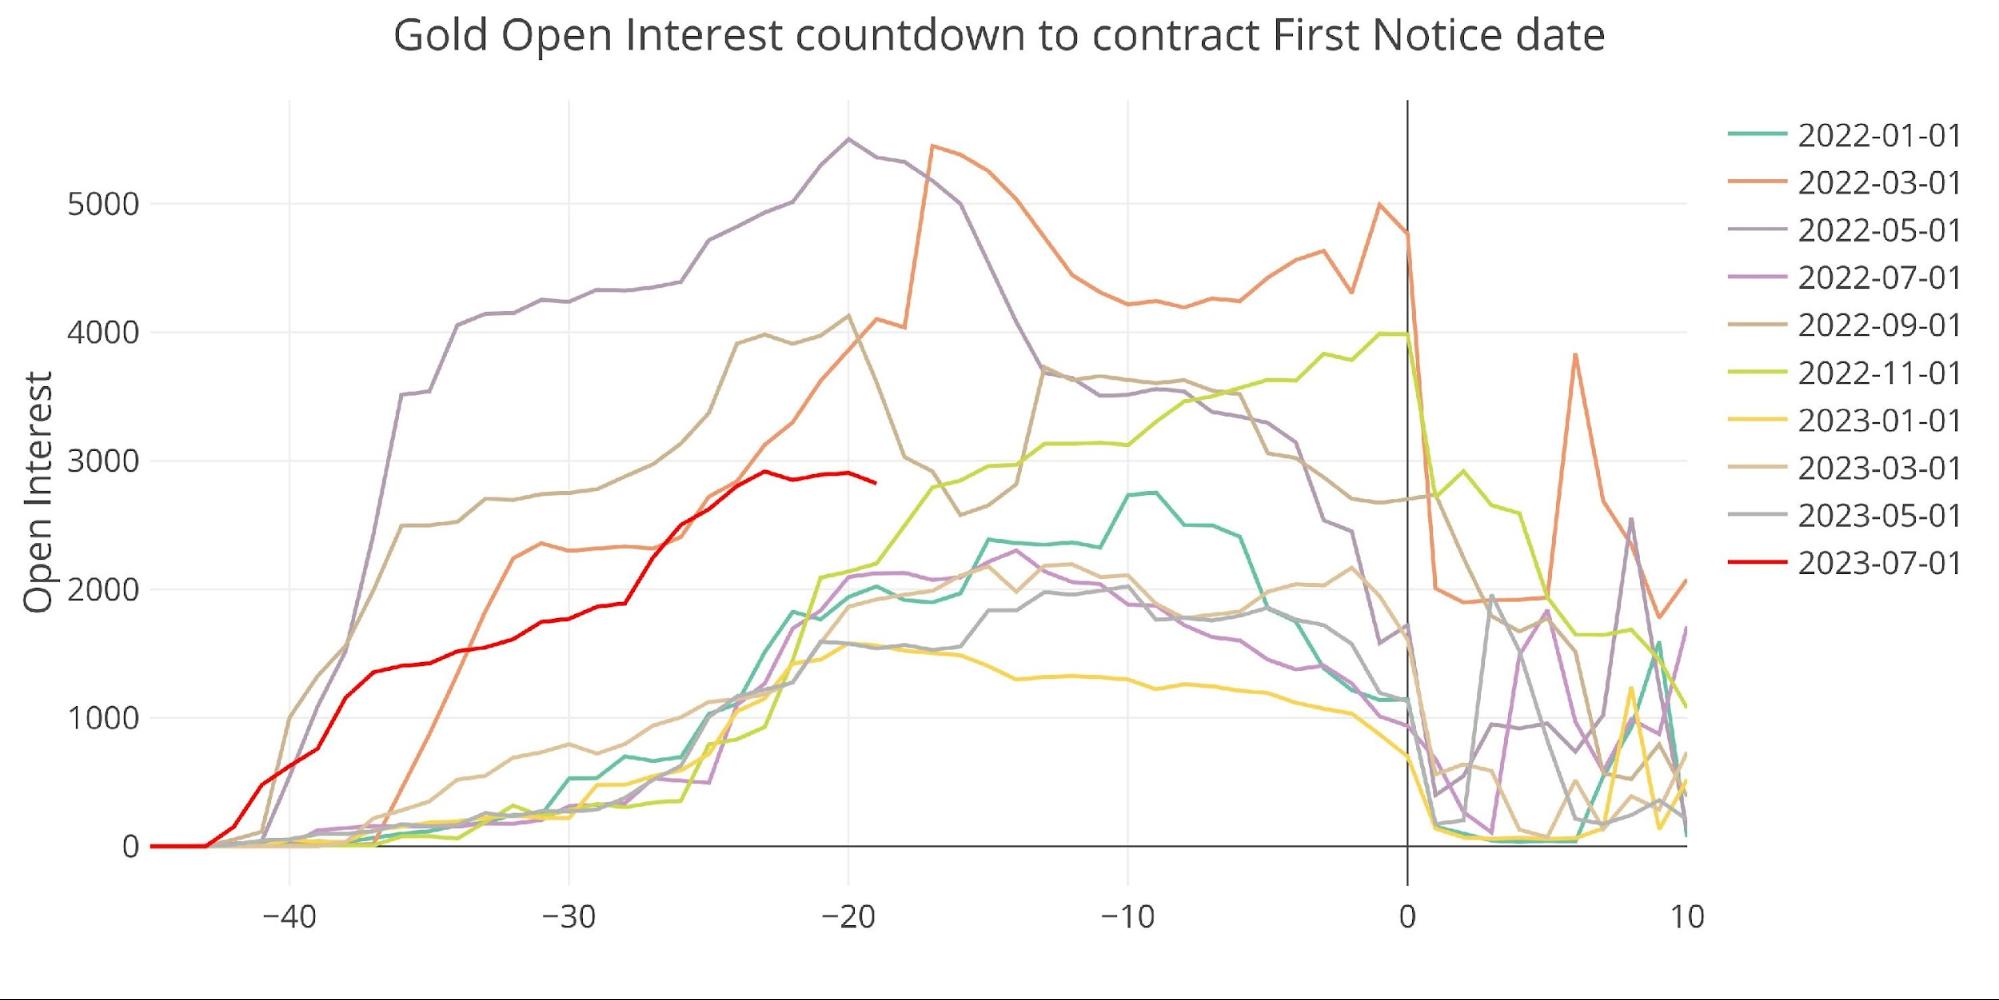
Figure: 7 Open Interest Countdown
On a basis relative to Registered metal, it looks even stronger.
(Click on image to enlarge)
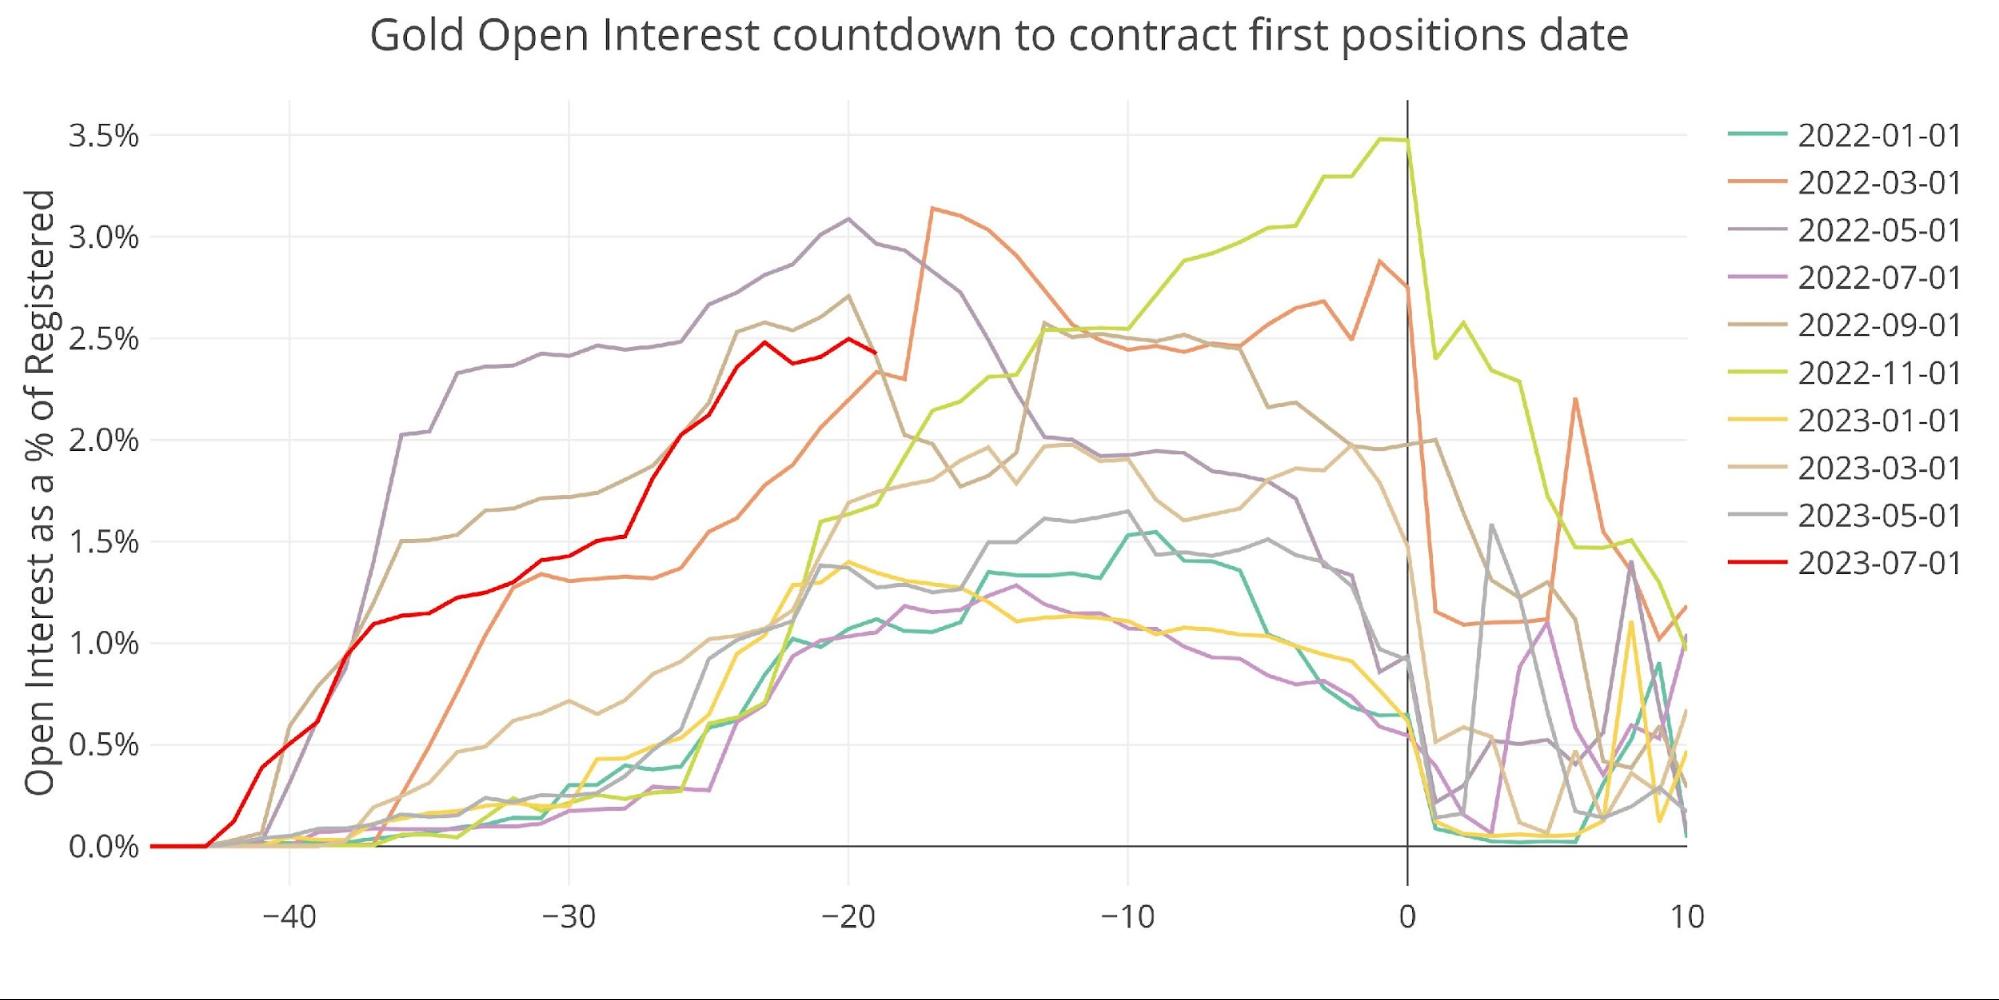
Figure: 8 Countdown Percent
Delivery volume remains steady in minor months, down from the peak but definitely still strong.
(Click on image to enlarge)
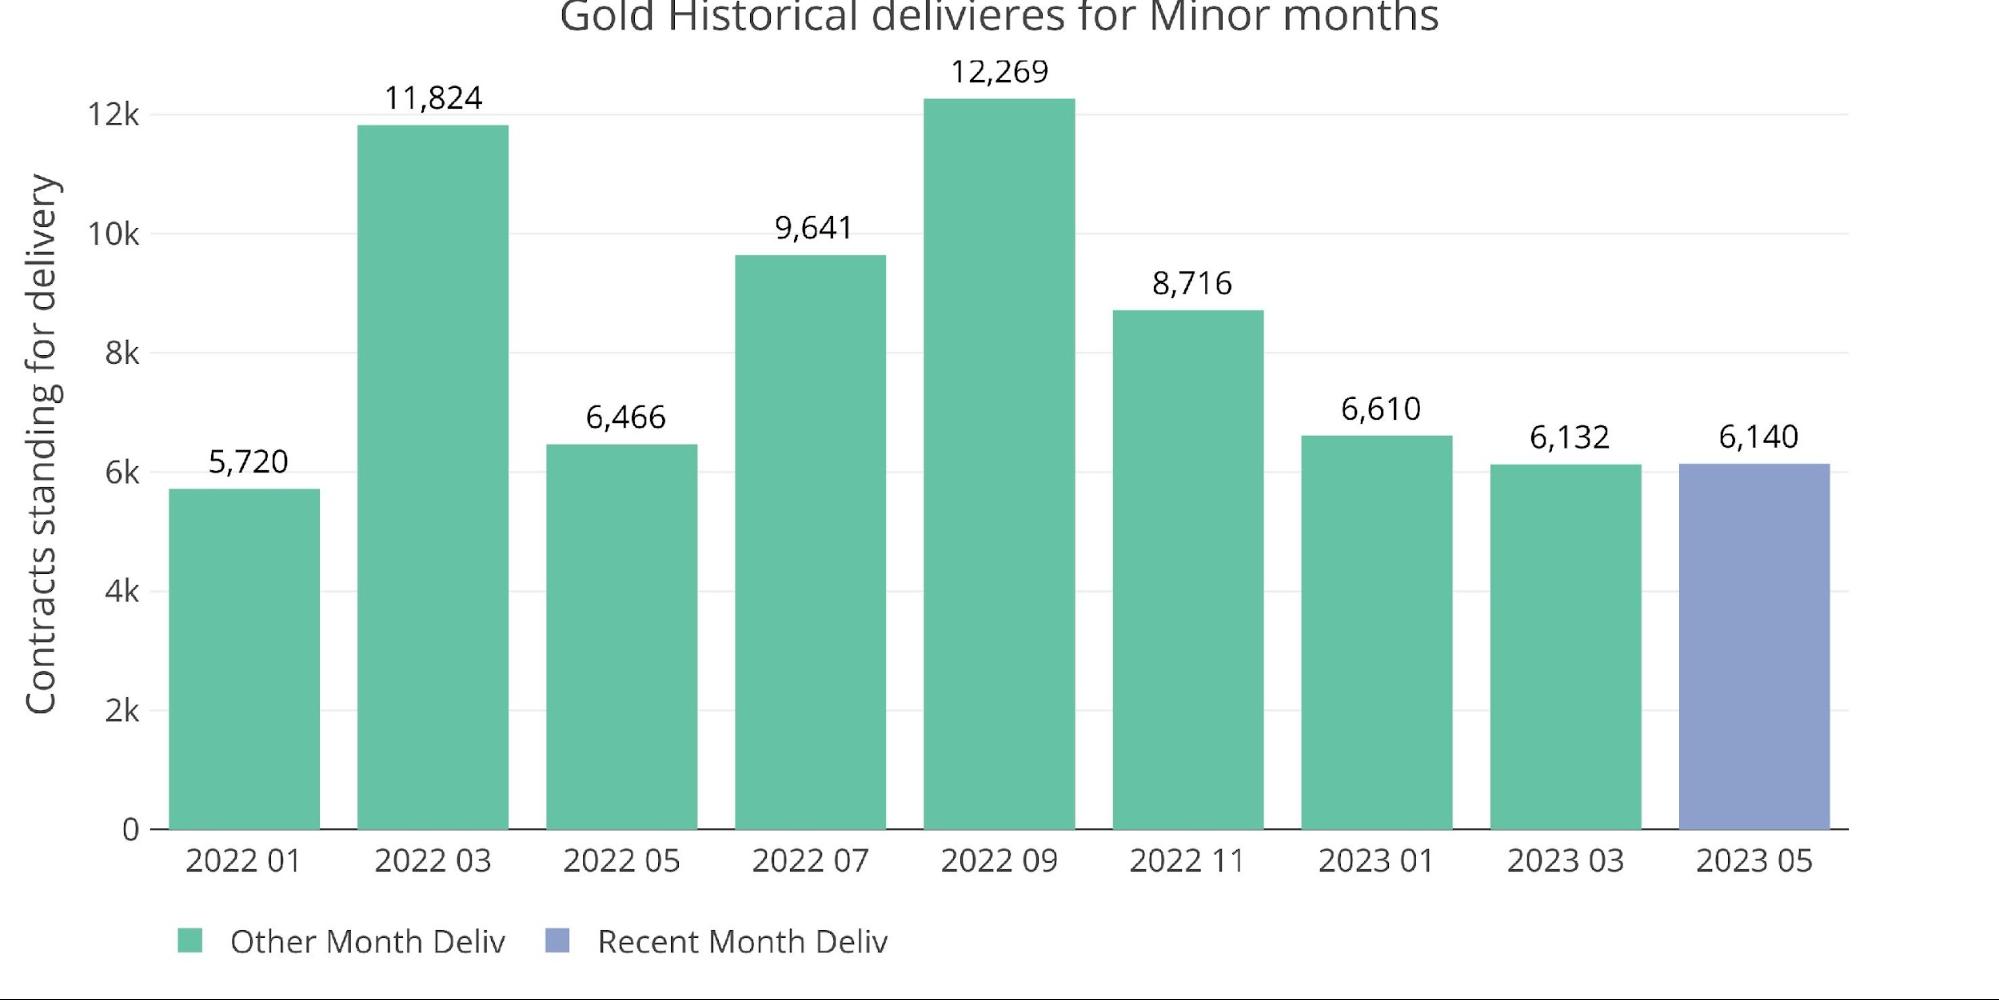
Figure: 9 Historical Deliveries
With the roll in the current contract from June to August, the spread has popped back up, once again in a very controlled fashion.
(Click on image to enlarge)
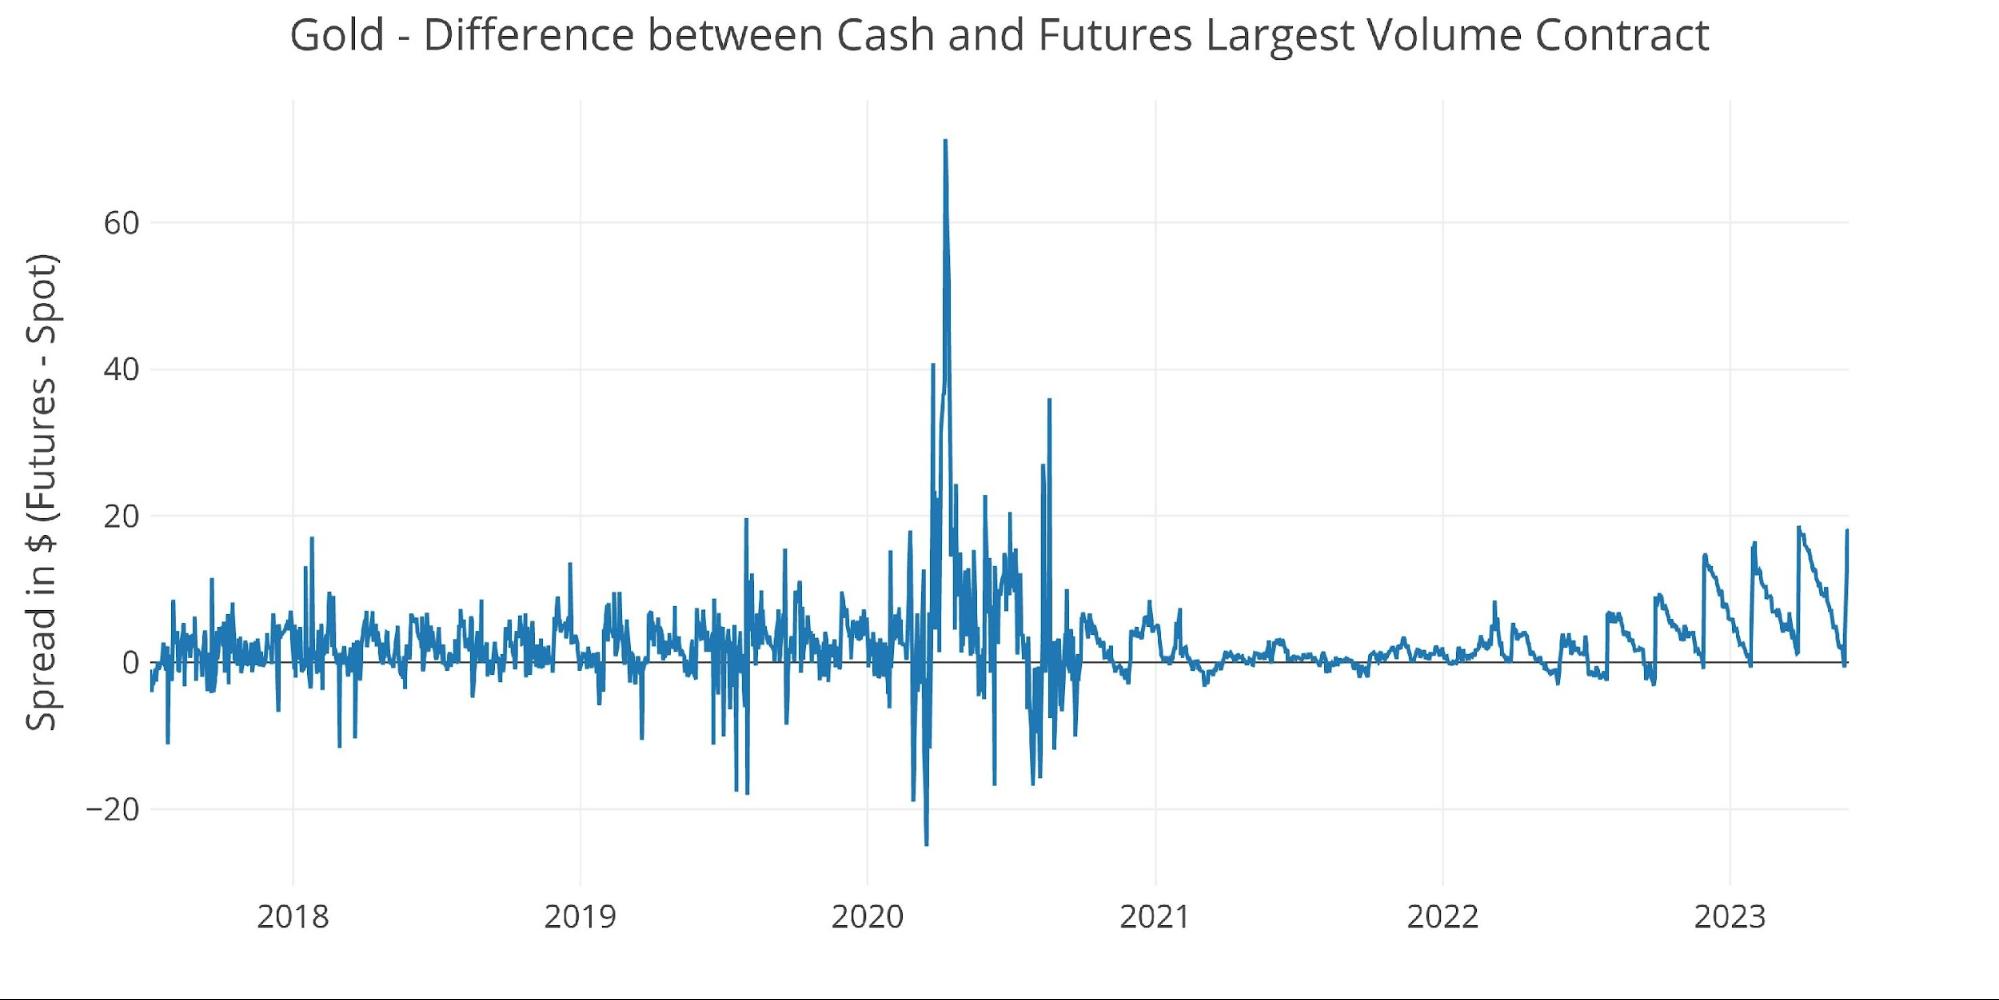
Figure: 10 Spot vs Futures
Silver: Recent Delivery Month
Silver has had 362 contracts delivered so far for June.
(Click on image to enlarge)
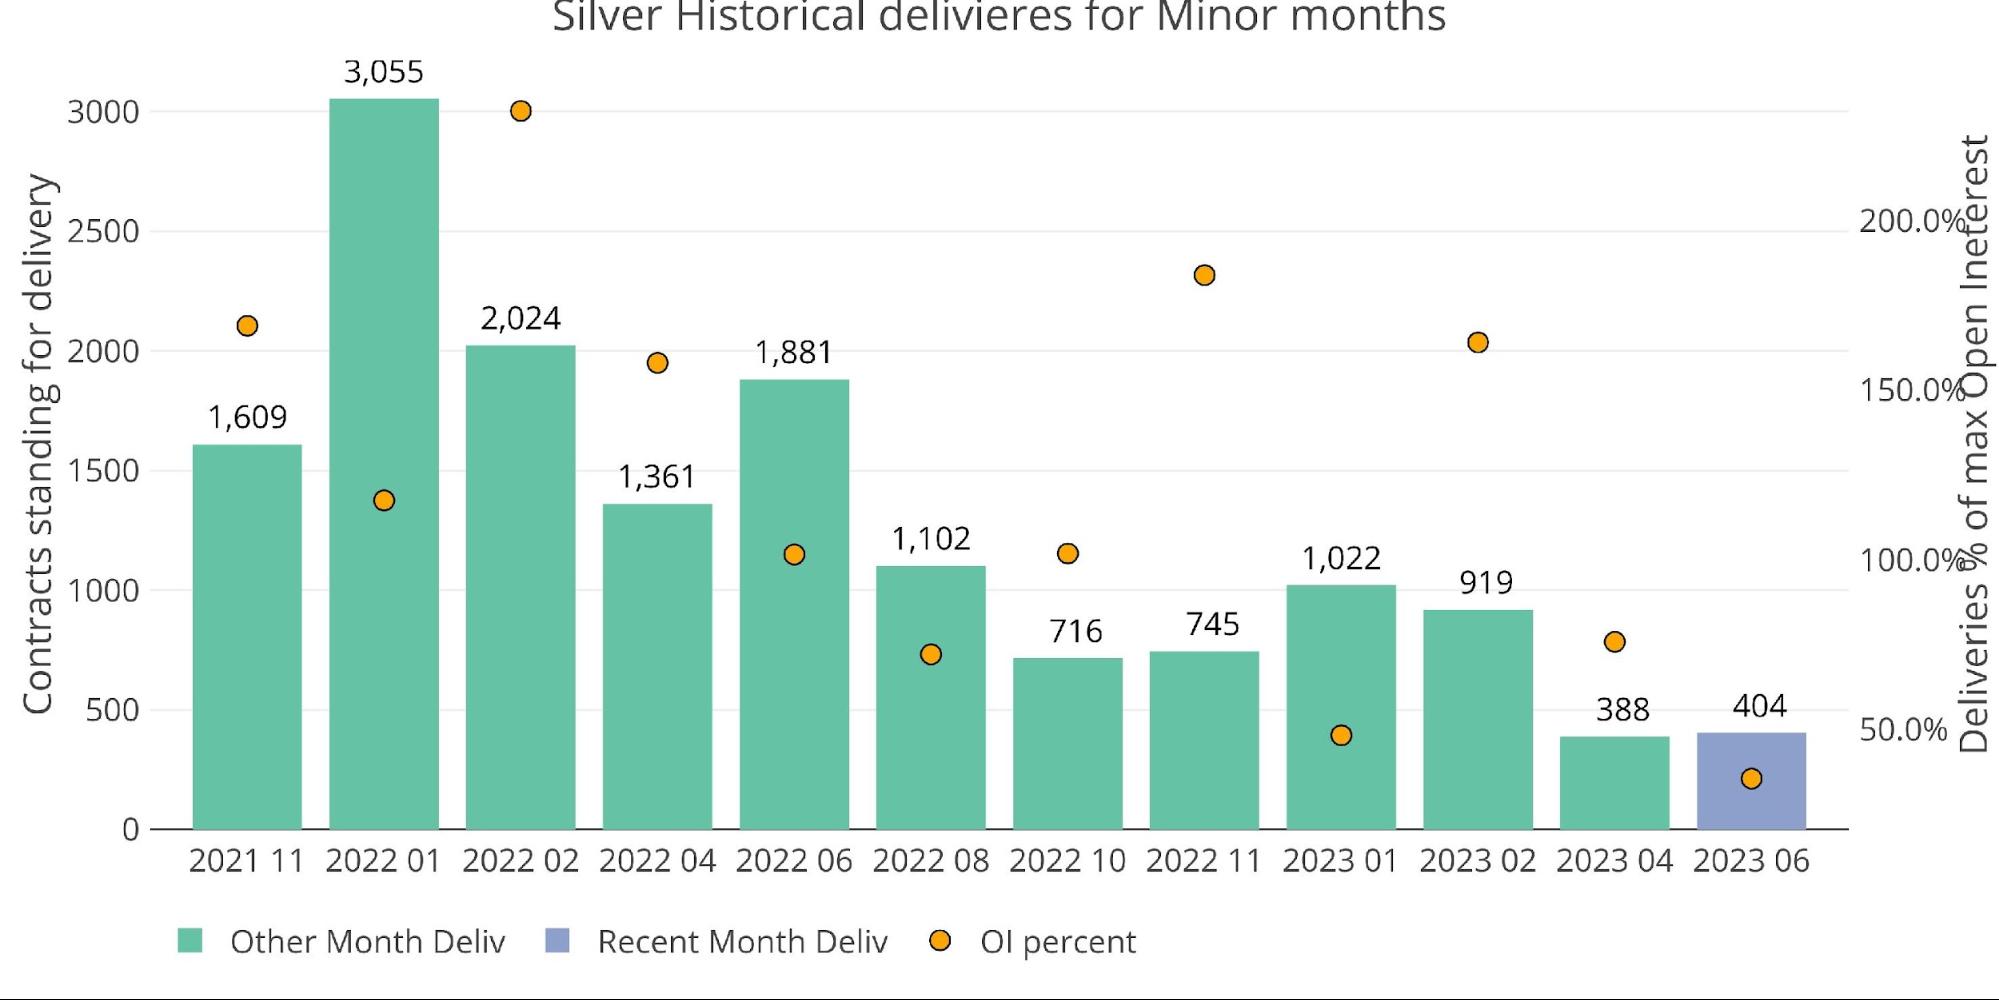
Figure: 11 Recent like-month delivery volume
The chart below shows that this represents about half of the contracts that were held as the delivery period got started. There are still 431 contracts in open interest which would bring the total to 800 contracts. Assuming that there are mid-month contracts for immediate delivery, June has the potential to be a big month.
(Click on image to enlarge)
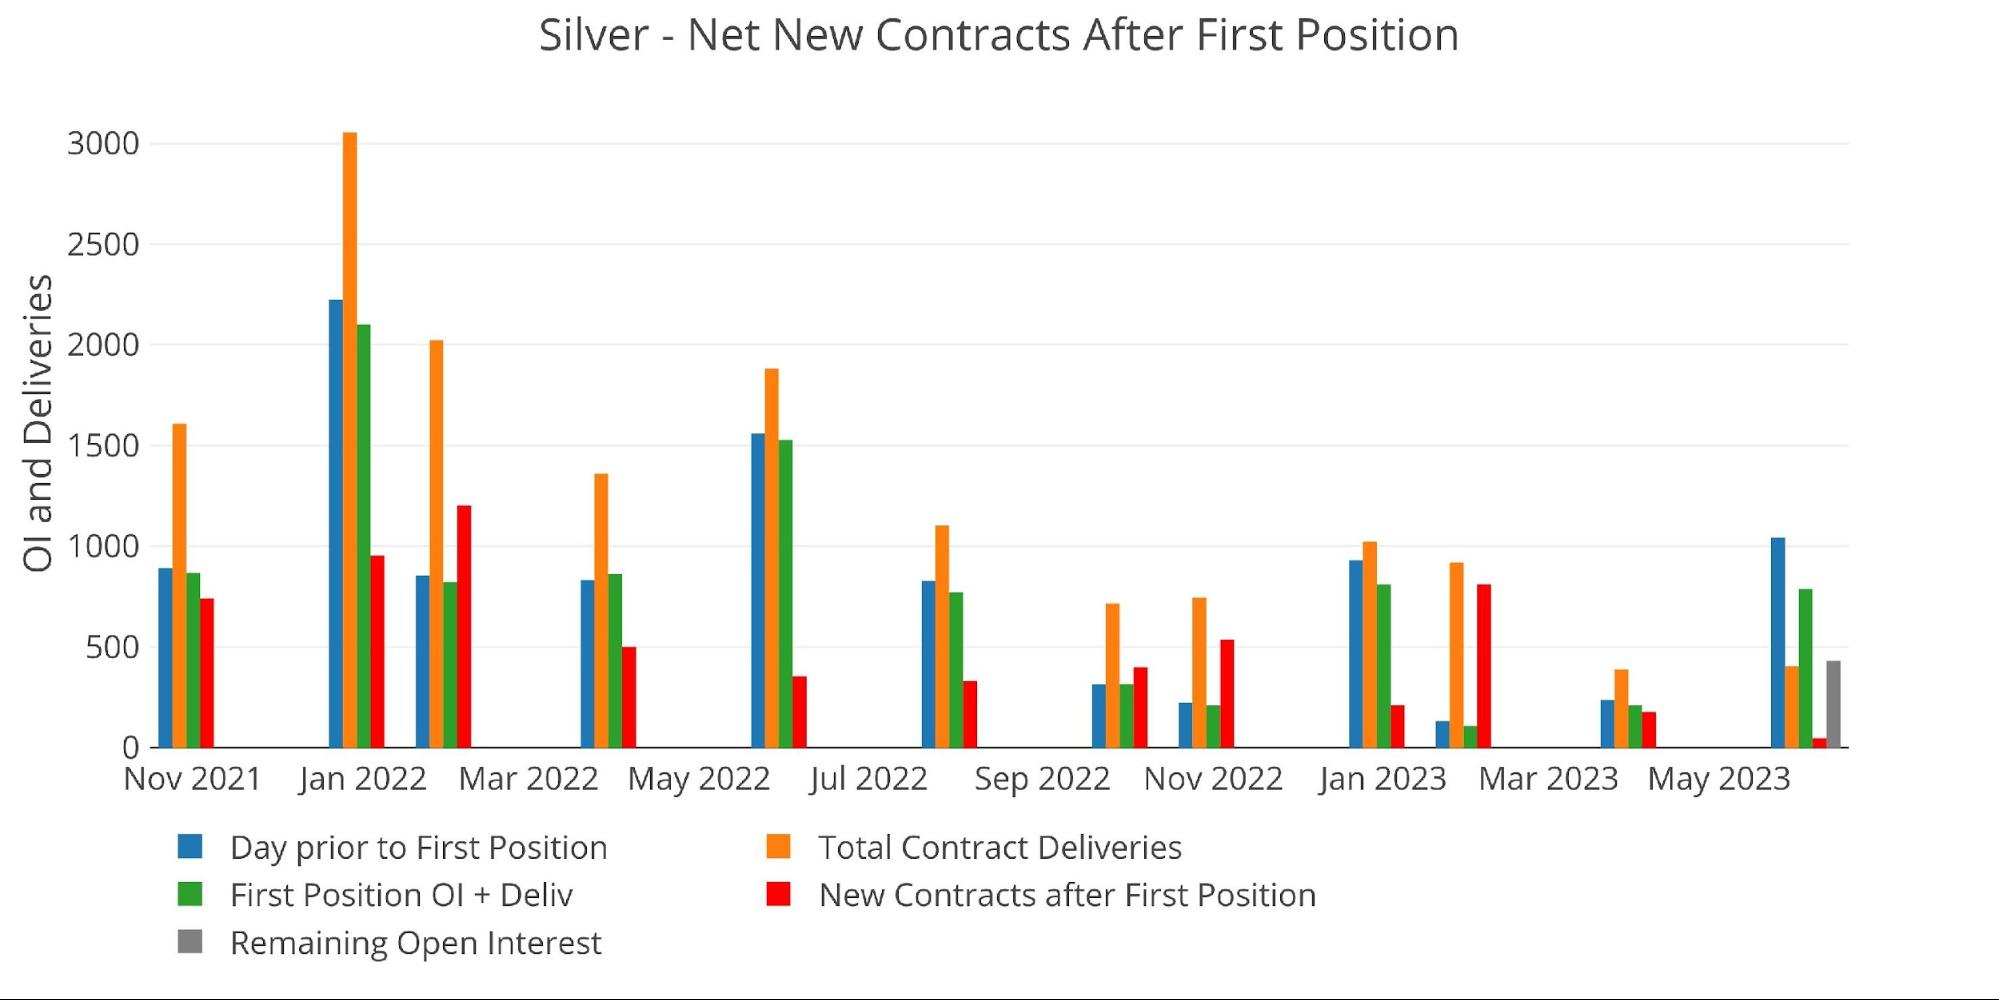
Figure: 12 24-month delivery and first notice
June has been strong for the last two years. It seems unlikely that silver will beat out the 2021 or 2022, but it isn’t impossible.
(Click on image to enlarge)
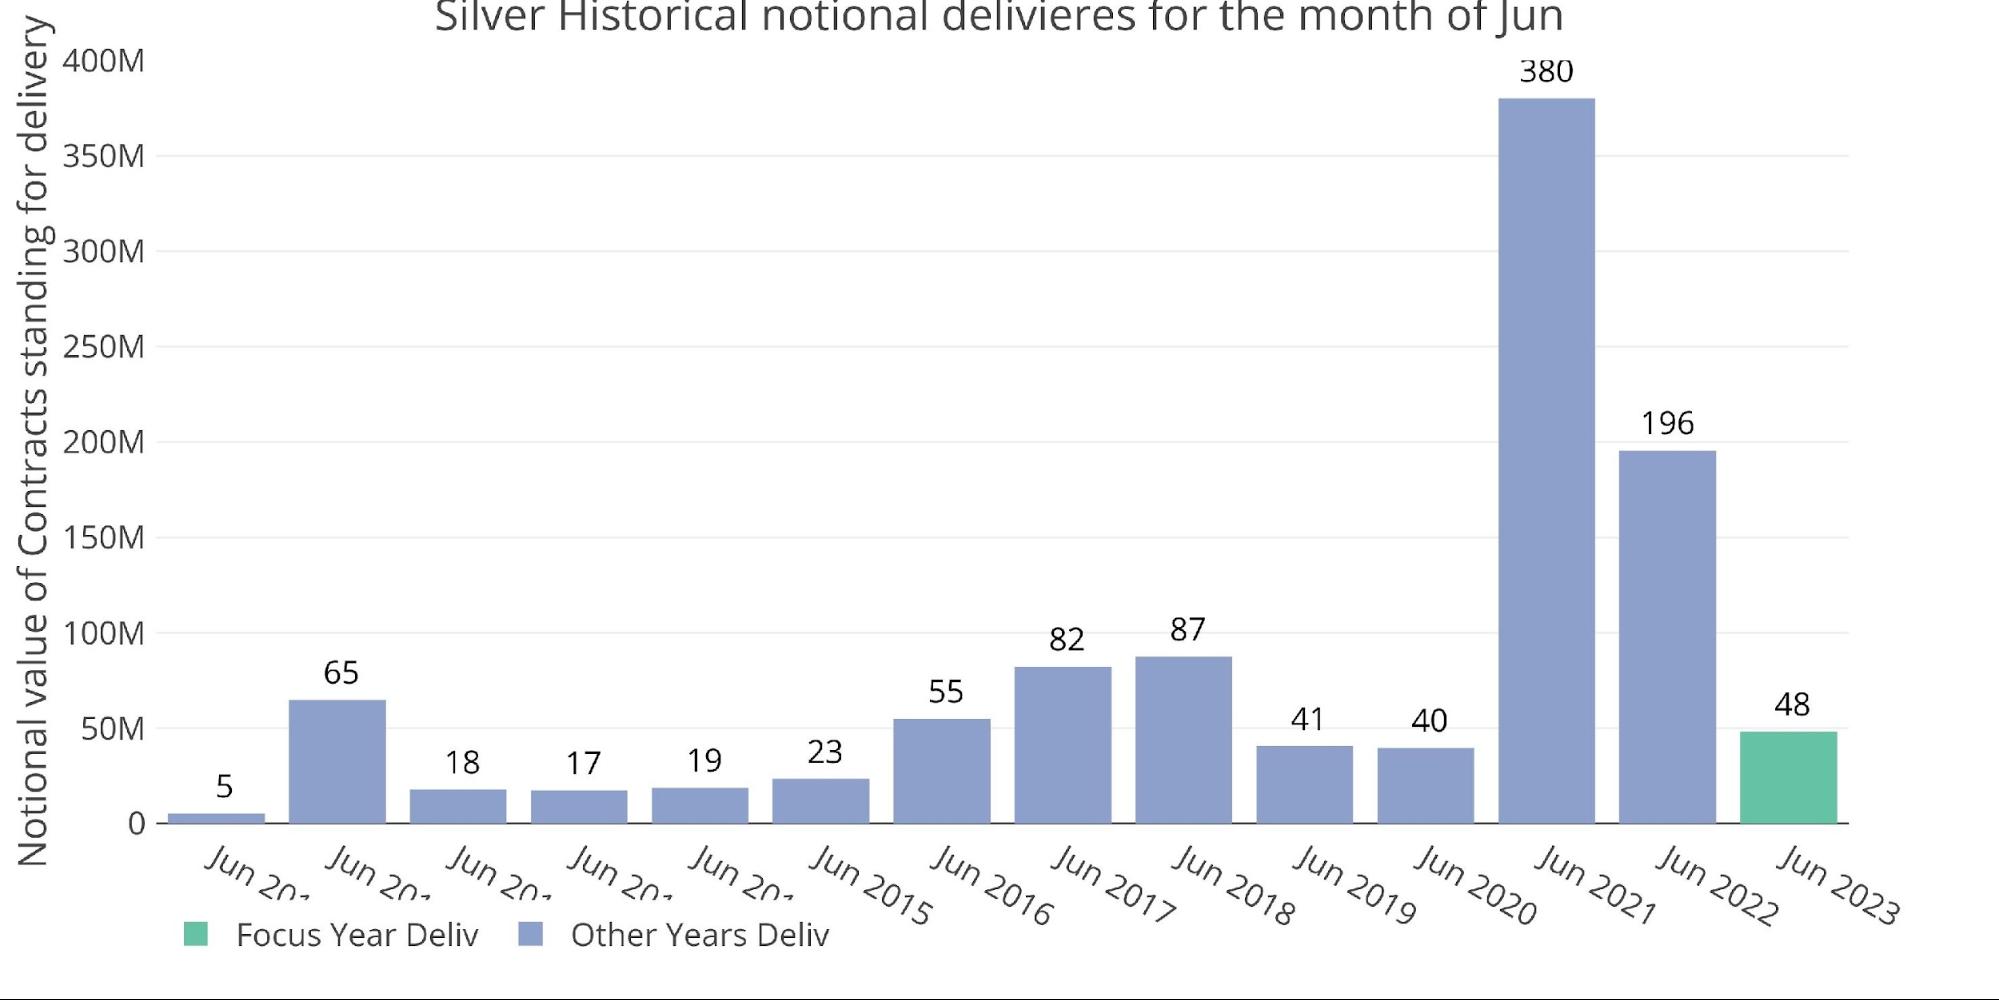
Figure: 13 Notional Deliveries
The activity in the physical vaults continues to show a pull of metal out of Registered. All attempts to restock Registered have failed. Since May 2nd, Eligible has increased by almost 10m ounces, but this is still nothing compared to how much has flown out since the start of the year.
After the big move yesterday, total Registered silver now stands at 28m ounces. For context, that number exceeded 150m in 2020. Supply is only 18% of what it used to be.
(Click on image to enlarge)
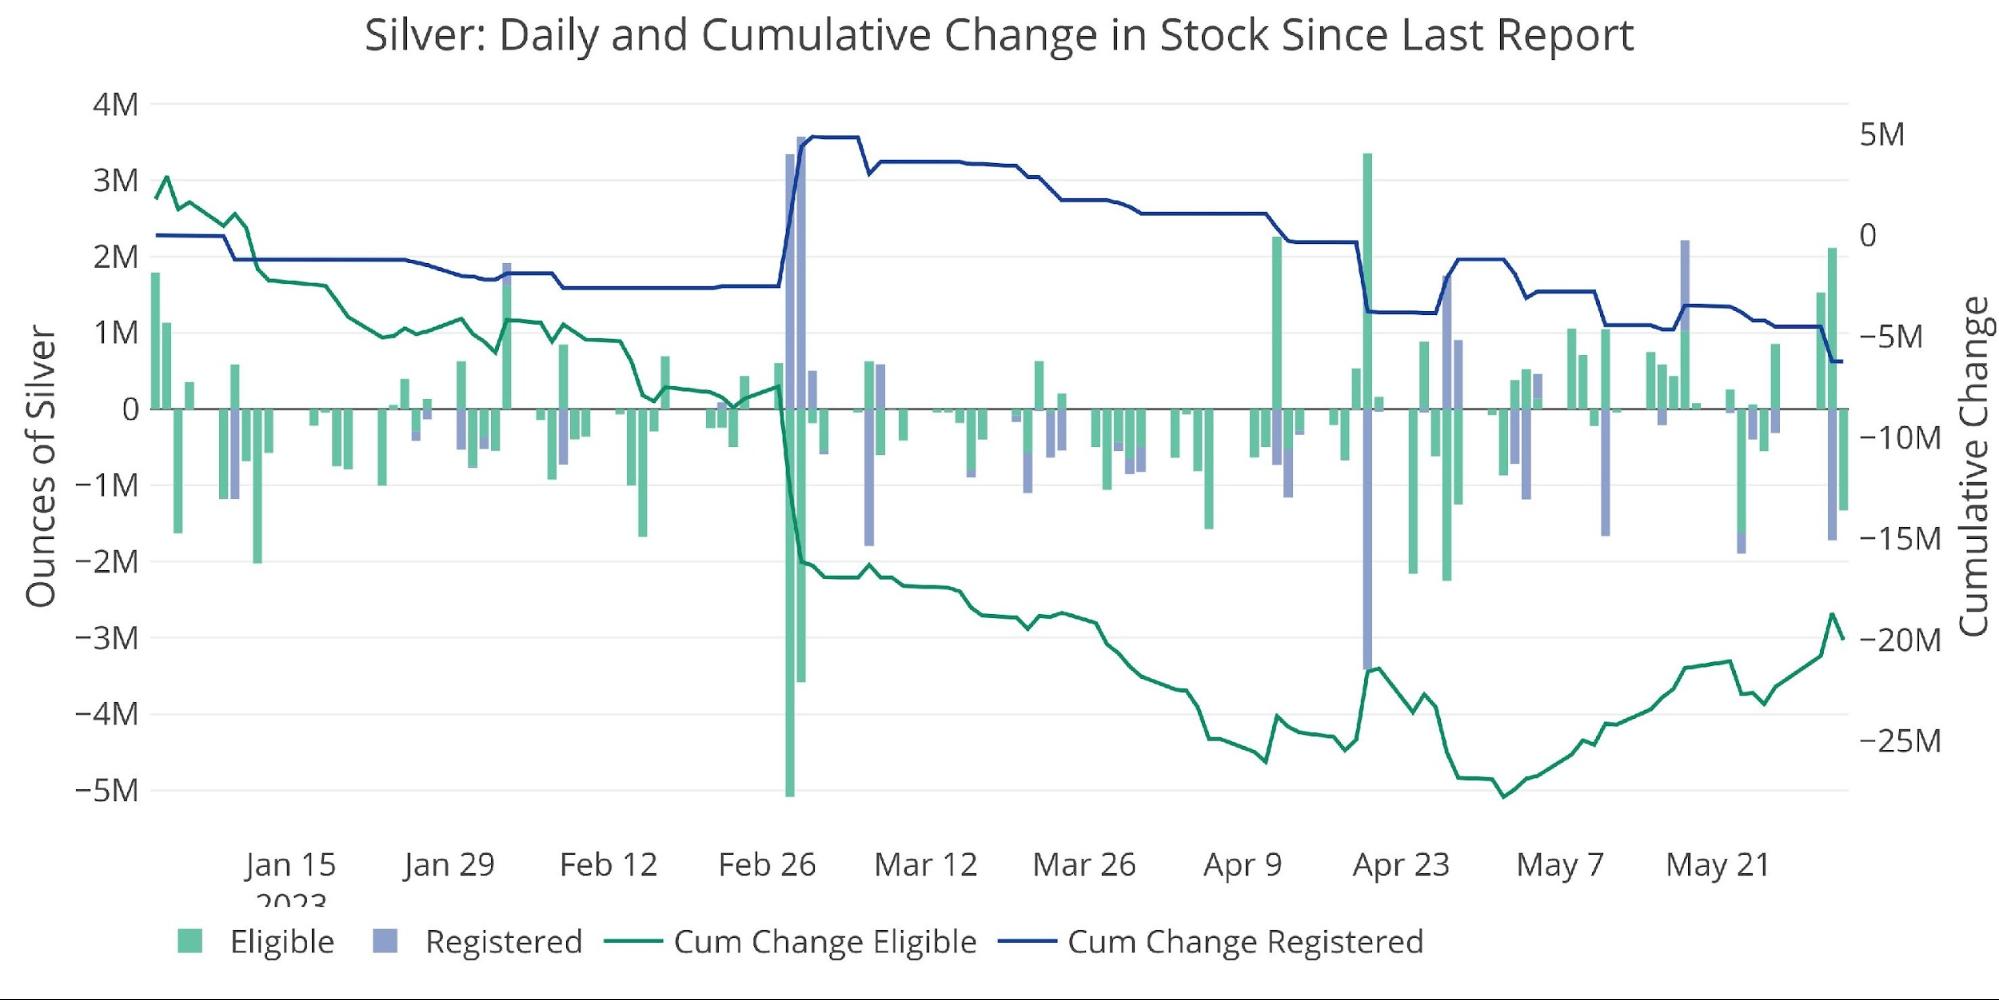
Figure: 14 Recent Monthly Stock Change
House Accounts
The house accounts are quiet so far this month, delivering 161 contracts. BofA has been fairly quiet for the last three months.
(Click on image to enlarge)
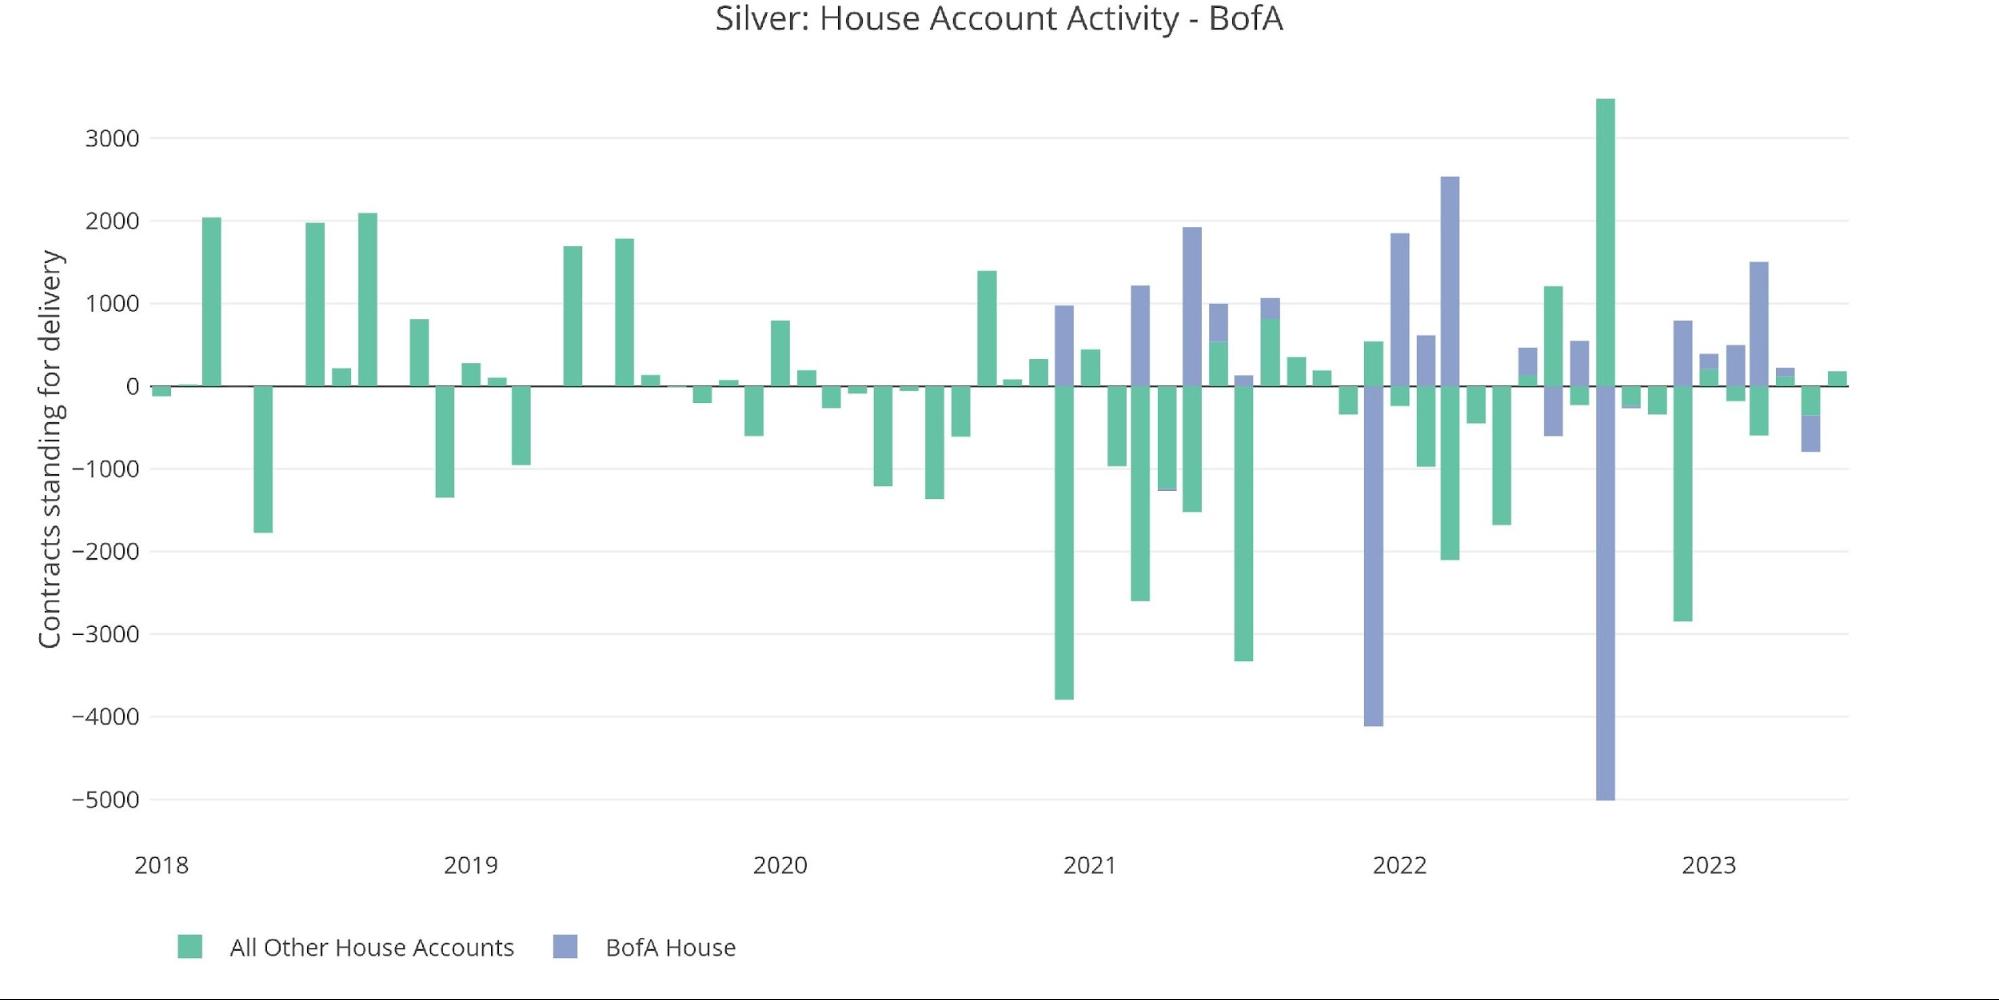
Figure: 15 House Account Activity
Silver: Next Delivery Month
July silver is actually below trend for this stage in the cycle when looking at total open interest.
(Click on image to enlarge)
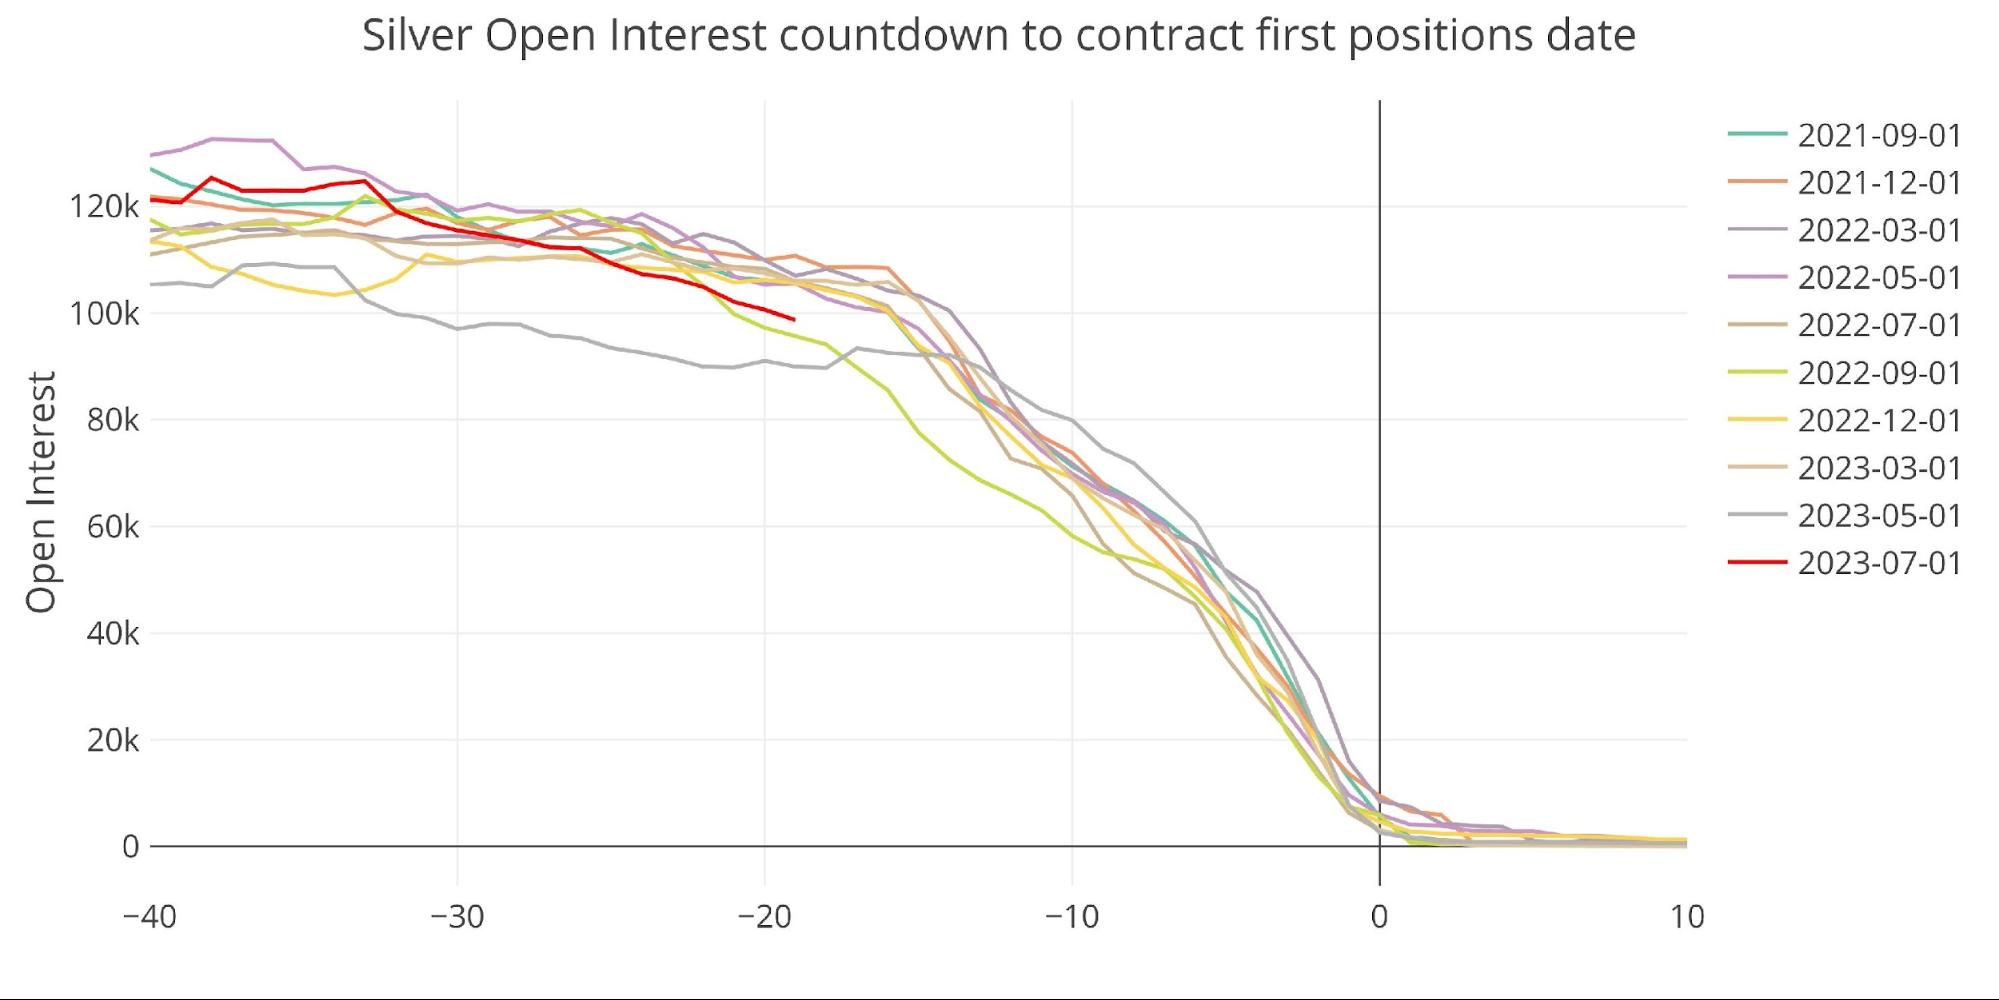
Figure: 16 Open Interest Countdown
When looking at a relative basis against metal available for delivery (Registered), July is actually well above other major months.
(Click on image to enlarge)
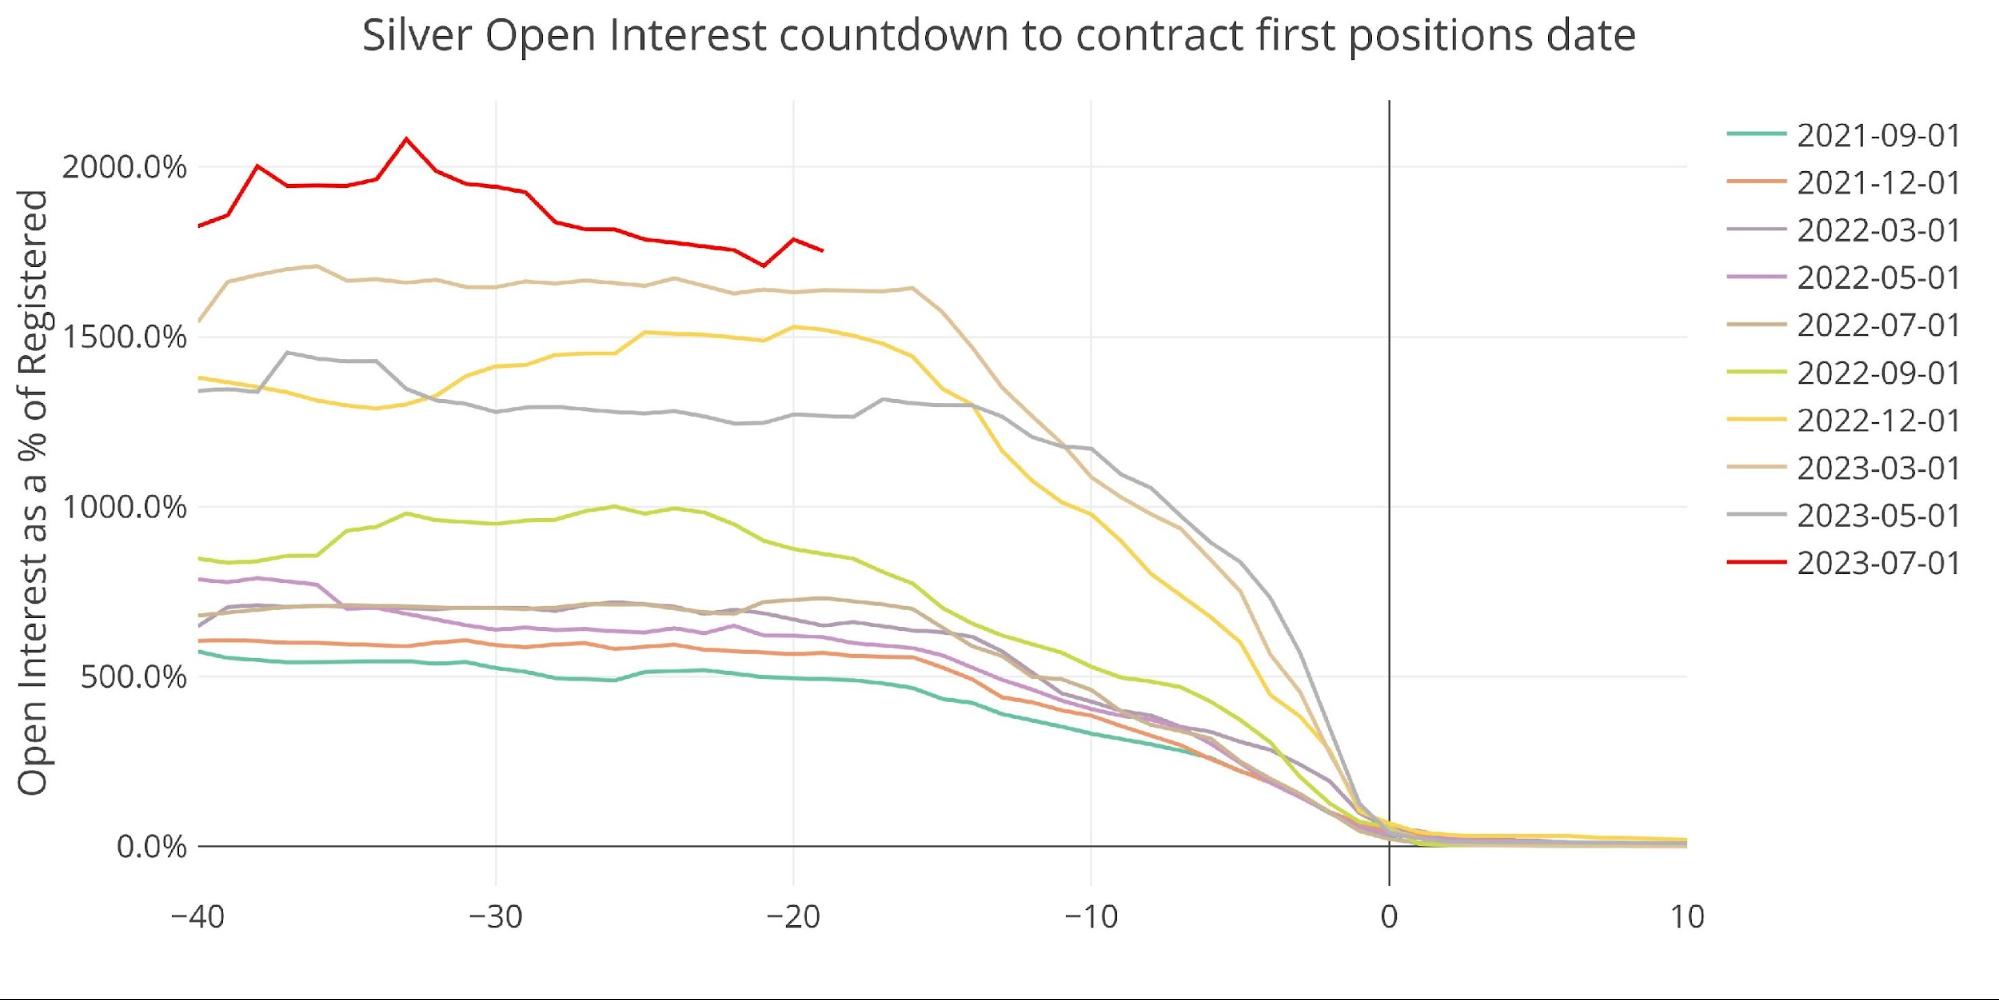
Figure: 17 Countdown Percent
Major month delivery volume has been dropping consistently ever since available supplies got so low. July has proven to be big in the past, so it wouldn’t be a surprise if it popped again.
(Click on image to enlarge)
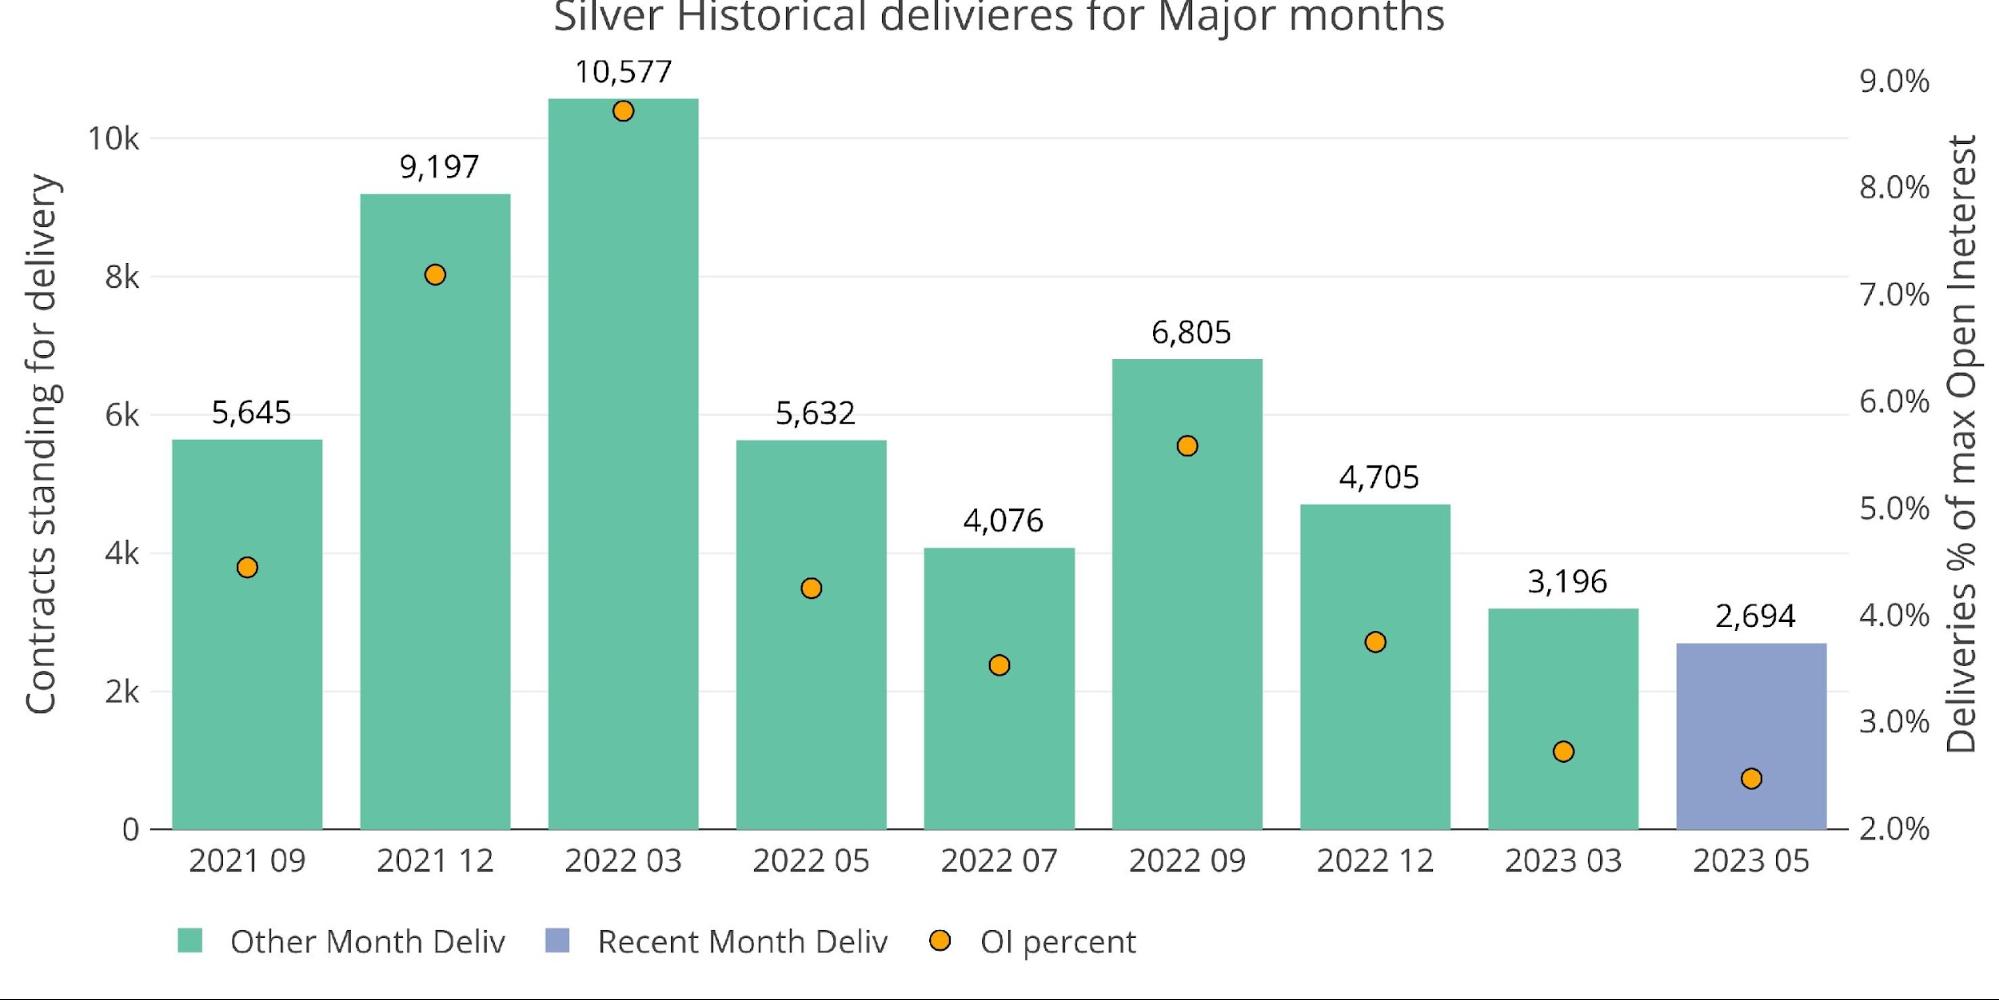
Figure: 18 Historical Deliveries
The spread in the futures market remains elevated.
(Click on image to enlarge)
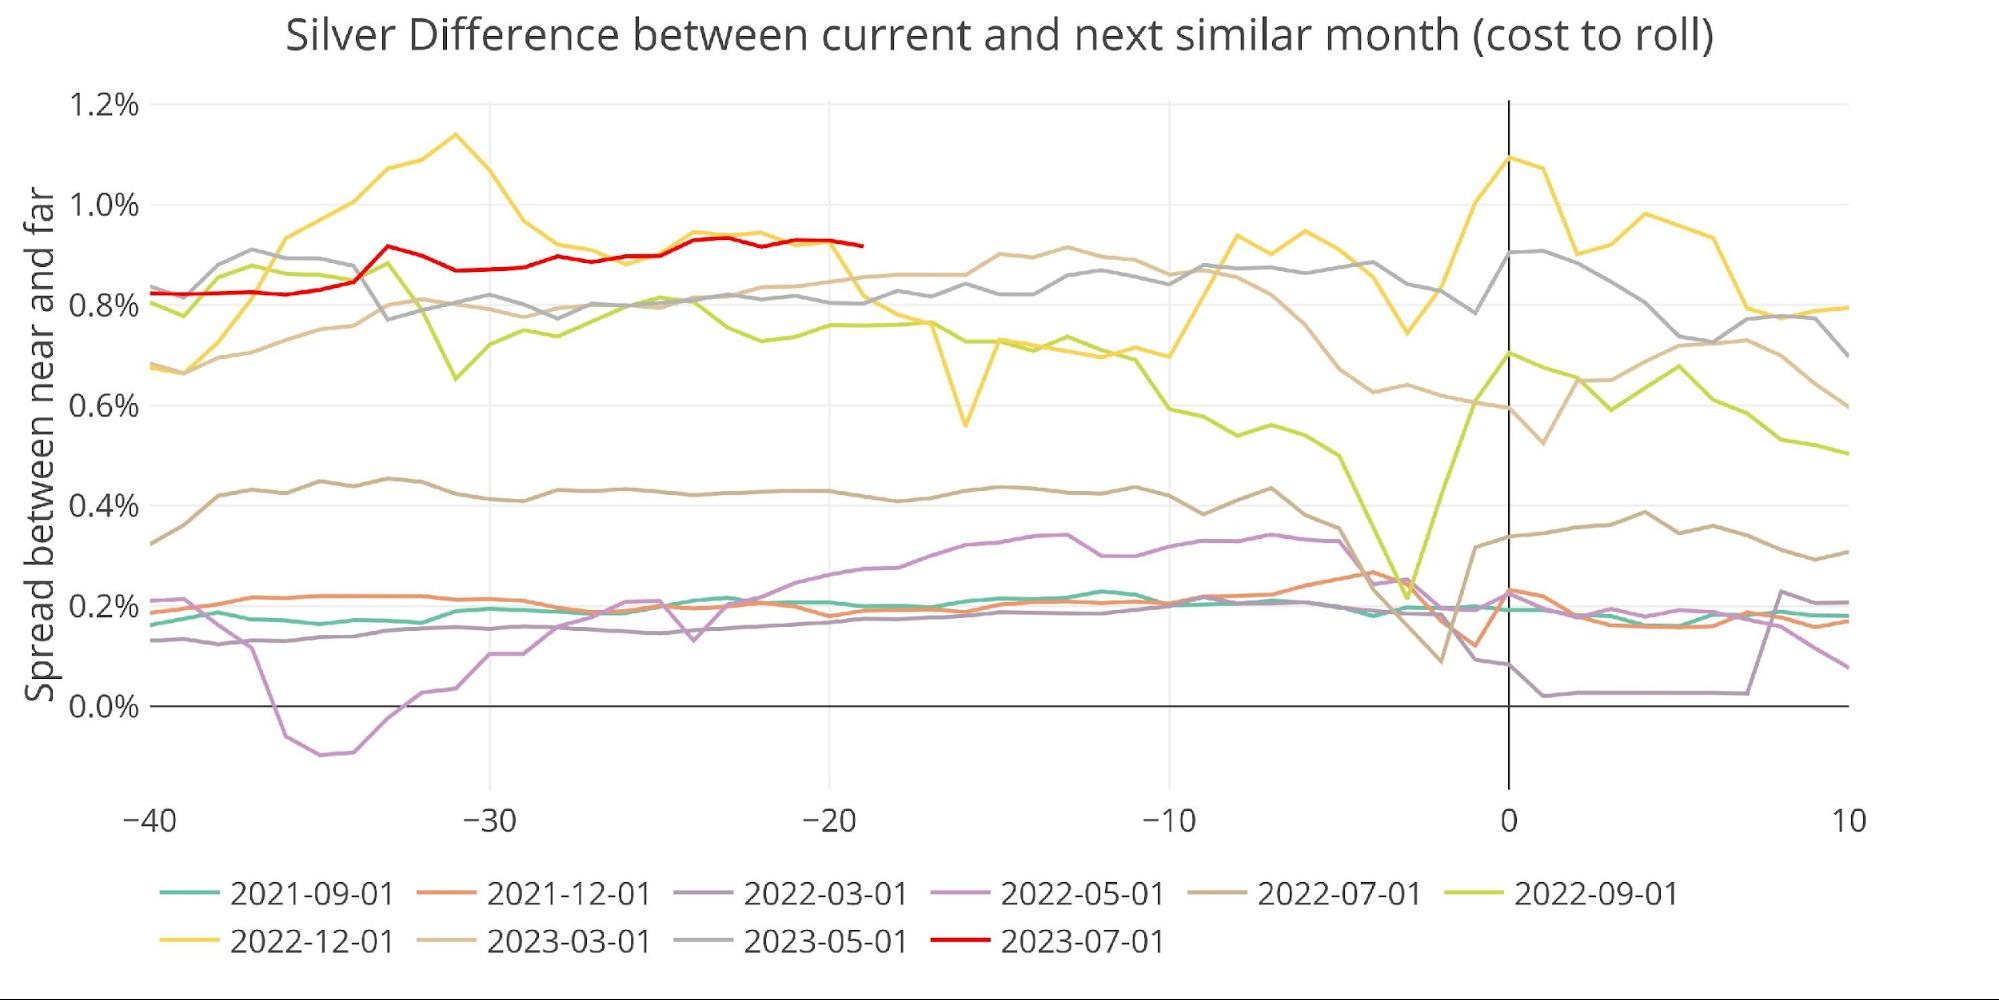
Figure: 19 Roll Cost
The spread in the cash market is still in contango, but moving down.
(Click on image to enlarge)
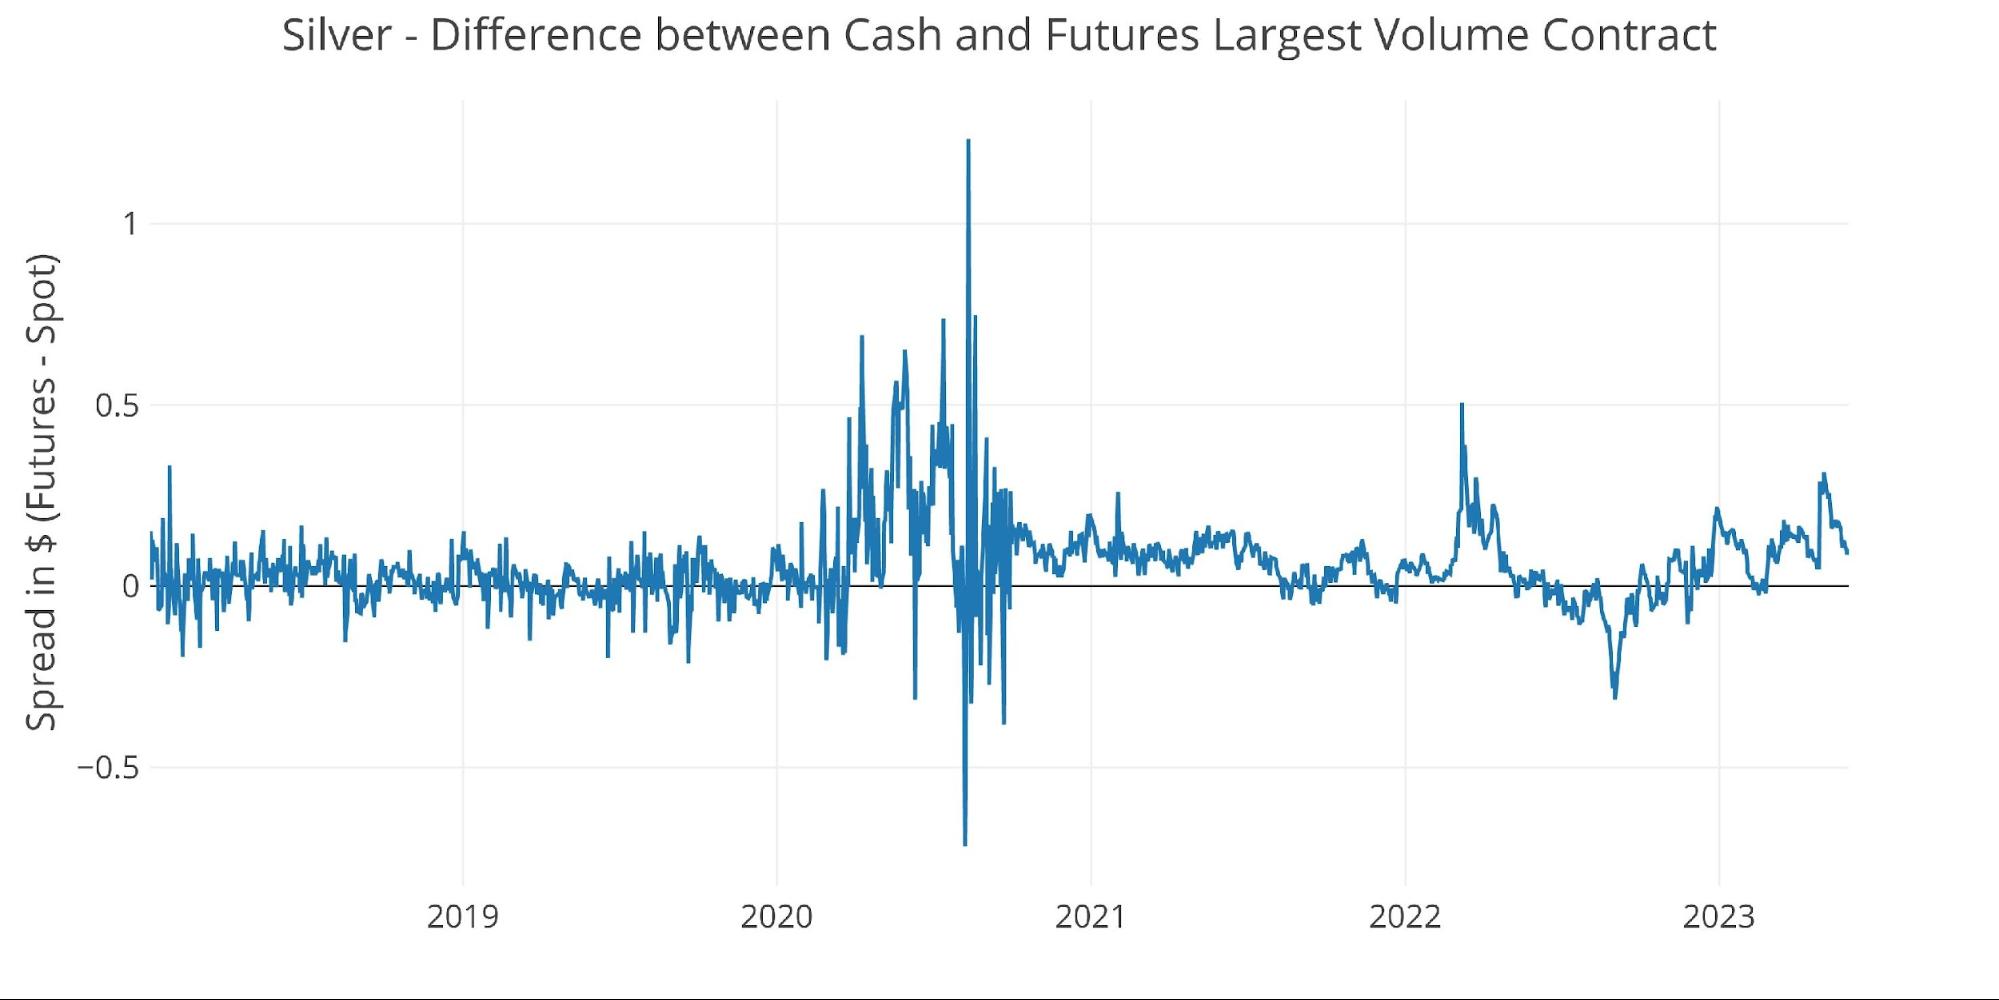
Figure: 20 Spot vs Futures
Palladium
Finally, we turn to Palladium where delivery volume hit the lowest level since March 2020.
(Click on image to enlarge)
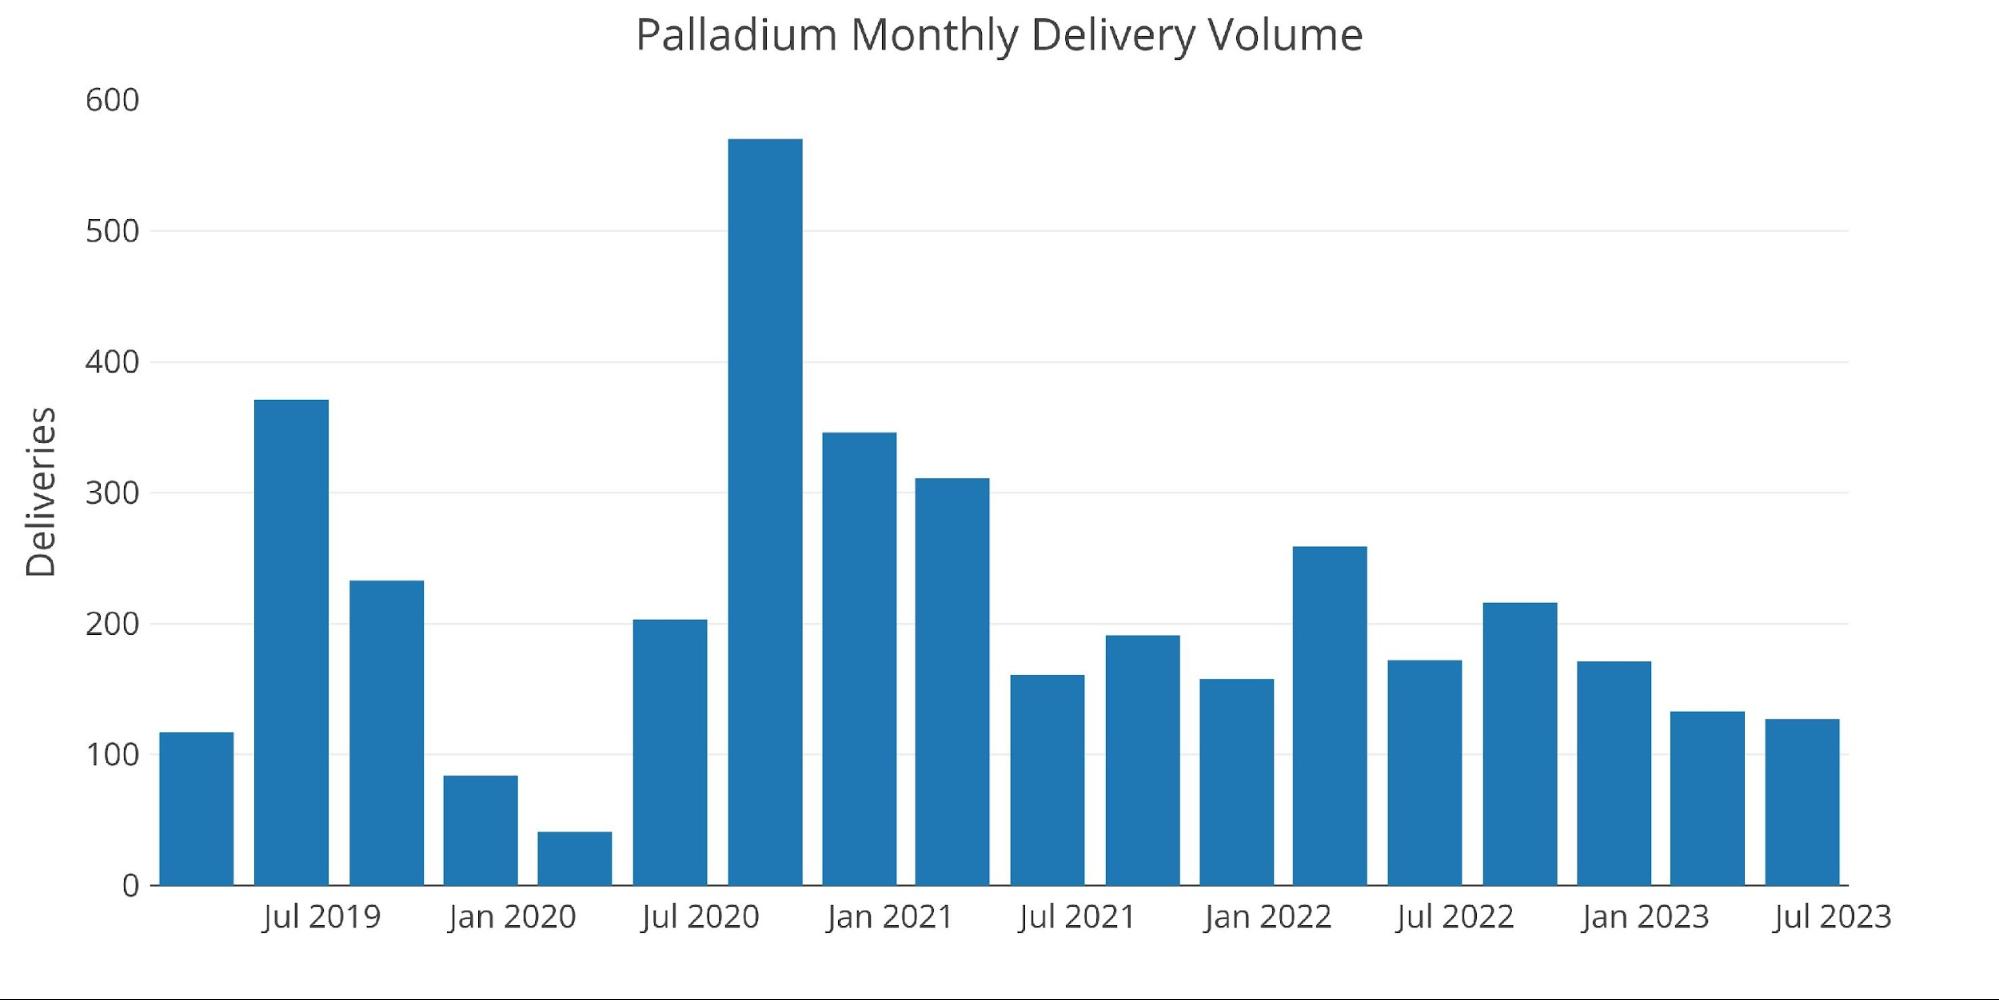
Figure: 21 Palladium Delivery Volume
The irony is that just a few days ago, the open interest was in record territory heading into the delivery window. This means that a ton of contracts rolled at the last possible moment.
(Click on image to enlarge)
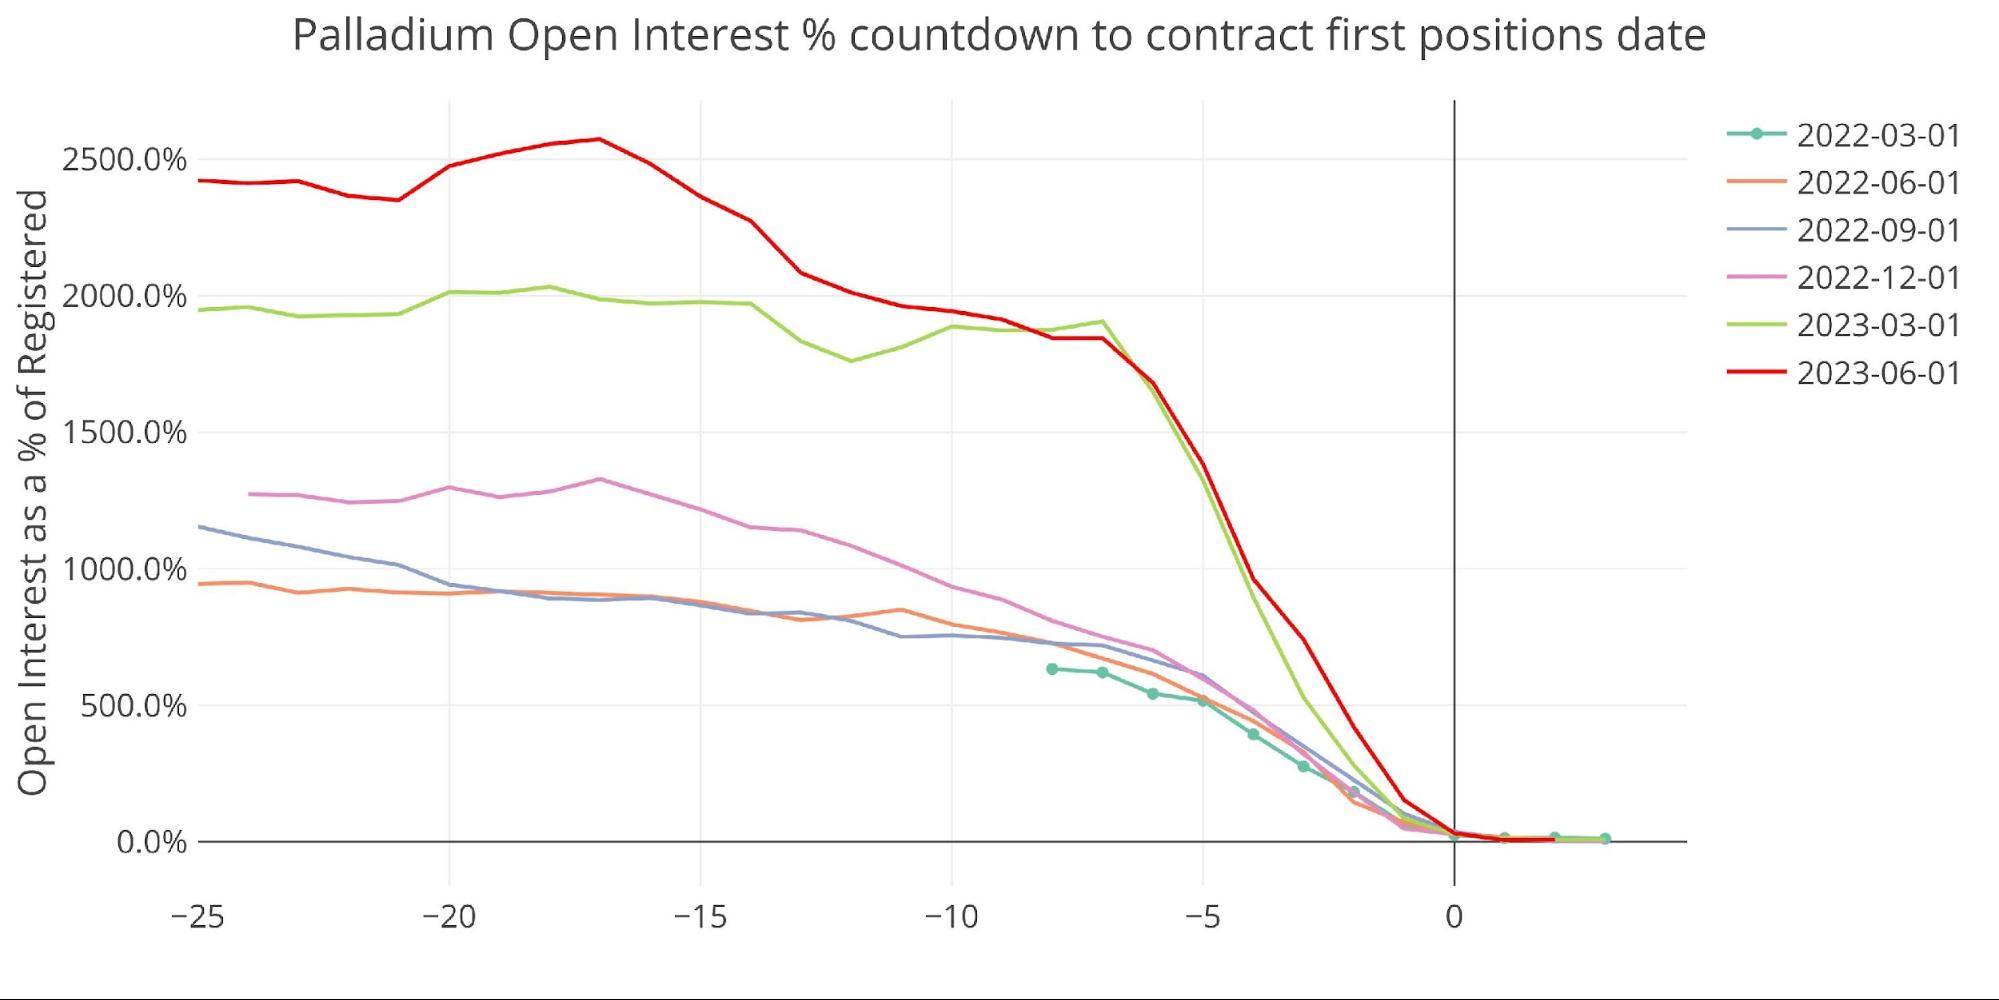
Figure: 22 Platinum Countdown Percent
Looking at physical inventory, there are only about 400 contracts worth of metal available for delivery. This could be the main reason why so many contracts roll… again, there just isn’t enough physical metal!
(Click on image to enlarge)
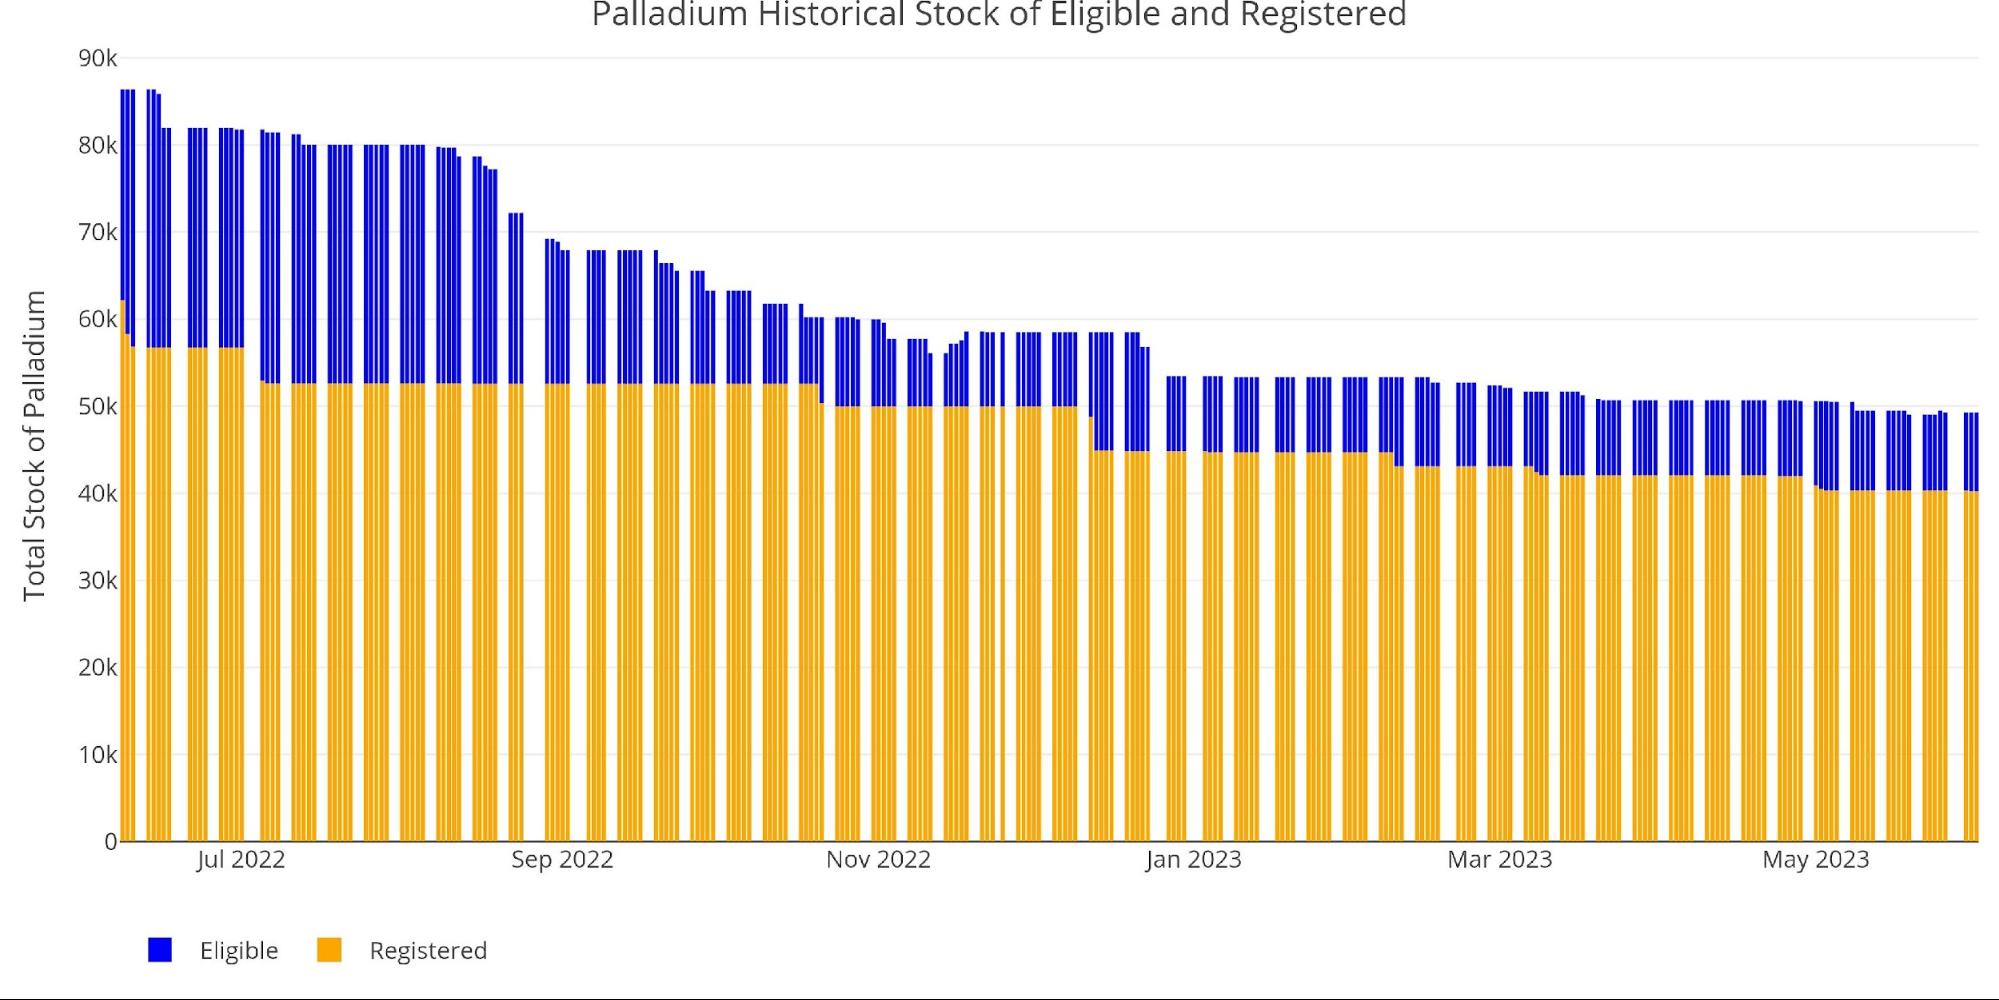
Figure: 23 Platinum Inventory
Wrapping up
The elevated delivery volume continues in both metals. It is down from the peak, but still quite high. Physical inventories have been depleted so there isn’t much metal left to backstop the delivery market. The data shows the pressure continuing to build. Eventually, the dam will break and the Comex will be forced to cash settle all contracts, not just 10% of gold contracts as they did this month.
Some investors are learning the meaning of – If you don’t hold it, you don’t own it.
(Click on image to enlarge)
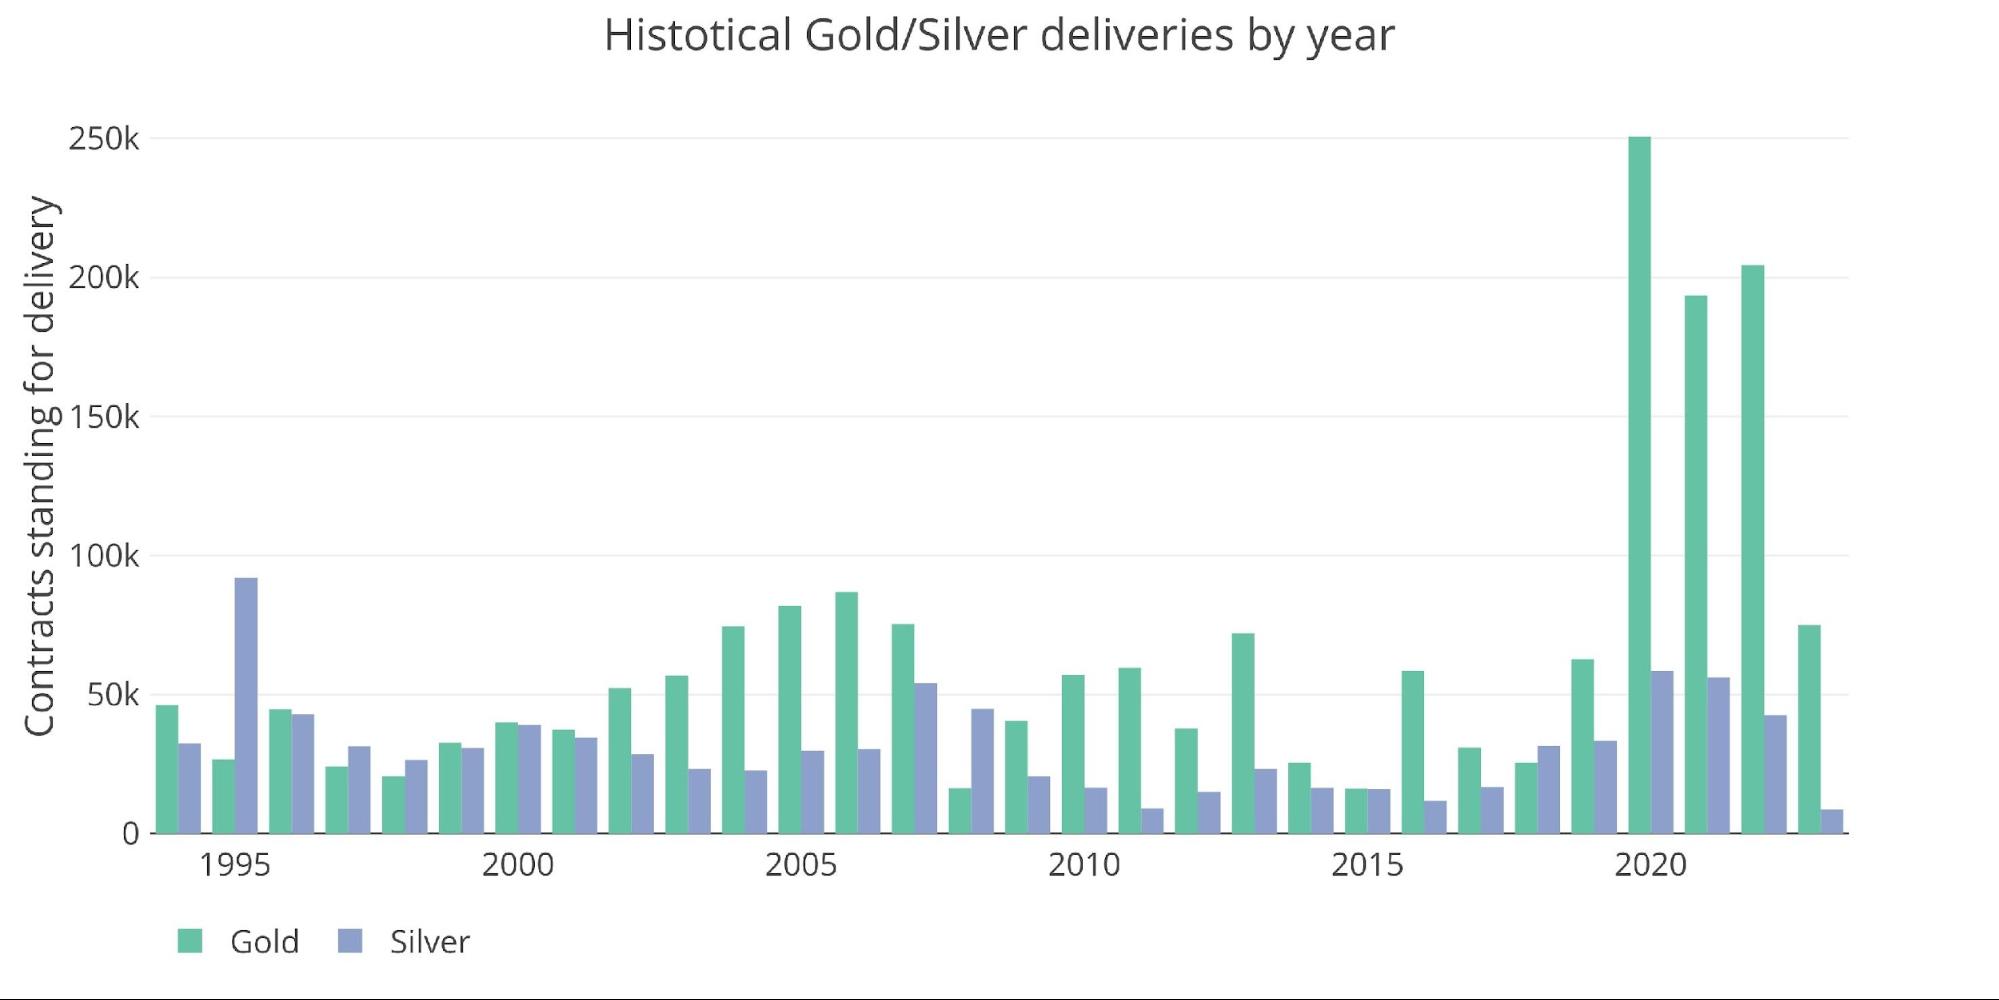
Figure: 24 Annual Deliveries
More By This Author:
Corporate Bankruptcies At Levels Last Seen During The PandemicThe Fed Blew Up Another Real Estate Bubble And It’s Losing Air
Americans Rank Gold As Second-Best Long-Term Investment


Comments
Log in or sign up to join the conversation.