
Gold Extends Bearish Series As US-China Trade Talk ’Moving Along Nicely’
The price for gold remains under pressure as the U.S. and China appear to be nearing a trade deal, and the precious metal may face a more bearish fate over the coming days as it extends the series of lower highs & lows from the previous week.
GOLD EXTENDS BEARISH SERIES AS US-CHINA TRADE TALK ‘MOVING ALONG NICELY’

Gold extends the decline following the U.S. Gross Domestic Product (GDP) report amid little to no signs of an imminent recession, and developments coming out of the world’s largest economy may continue to drag on the precious metal as President Donald Trump tweets that ‘we are moving along nicely with trade discussions.’
In response, the Federal Reserve may find it difficult to abandon the hiking-cycle as the new deal with China is expected to improve the terms of trade, and signs of stick inflation may push Chairman Jerome Powell & Co. to project a longer-run interest rate of 2.75% to 3.00% at the next rate decision on March 20 especially as the U.S. Non-Farm Payrolls (NFP) report is anticipated to show the economy adding another 185K job in February.
(Click on image to enlarge)
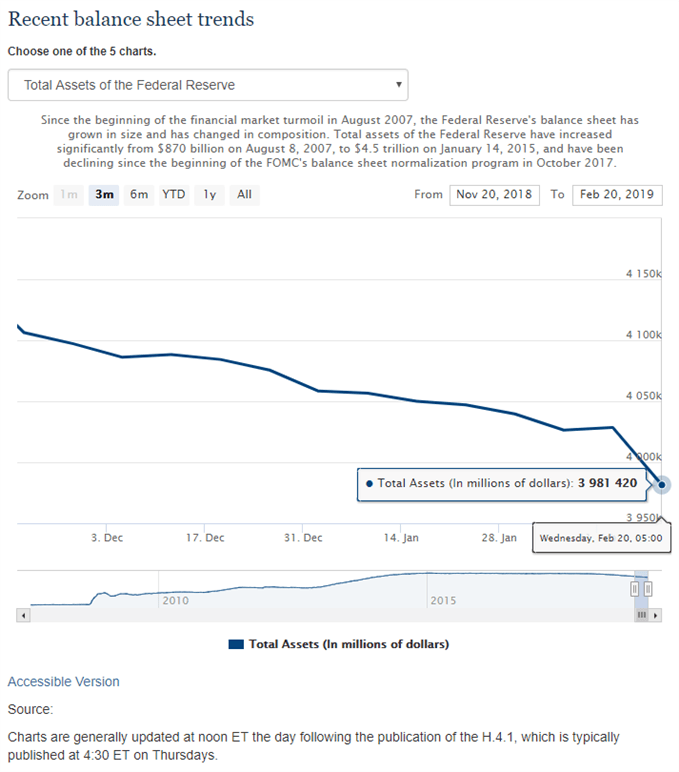
With that said, the Federal Open Market Committee (FOMC) may try to squeeze in a rate-hike later this year as officials ‘expect that the American economy will grow at a solid pace in 2019,’ but the central bank appears to be on track to preparing to taper the $50B/month in quantitative tightening (QT) as Chairman Powell states that ‘the Committee can now evaluate the appropriate timing and approach for the end of balance sheet runoff.’
In turn, developments coming out of the U.S. economy may continue impact gold prices as the FOMC alters the forward-guidance, and the broader outlook for bullion remains constructive as a growing number of Fed officials endorse a wait-and-see approach for monetary policy. However, the failed attempt to test the 2018-high ($1366) has triggered a near-term correction in gold, with bullion at risk of exhibiting a more bearish behavior over the coming days as both price and the Relative Strength Index (RSI) snap the upward trends carried over from late last year.
GOLD DAILY CHART
(Click on image to enlarge)
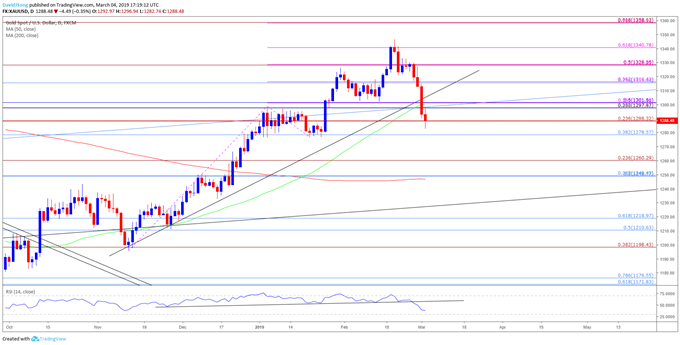
- The advance from the November-low ($1196) continues to unravel amid the lack of momentum to test the 2018-high ($1366), with the recent series of lower highs & lows brings the downside targets as the former-resistance zone around $1298 (23.6% retracement) to $1302 (50% retracement) fails to provide support.
- In turn, a break/close below the $1279 (38.2% retracement) to $1288 (23.6% expansion) region raises the risk for a move towards $1260 (23.6% expansion), with the next area of interest coming in around $1249 (50% retracement) to $1250 (38.2% retracement).


