
Gold And Cable At Critical Junctures
GBPUSD
30 min
(Click on image to enlarge)
4 Hours
(Click on image to enlarge)
Daily
(Click on image to enlarge)

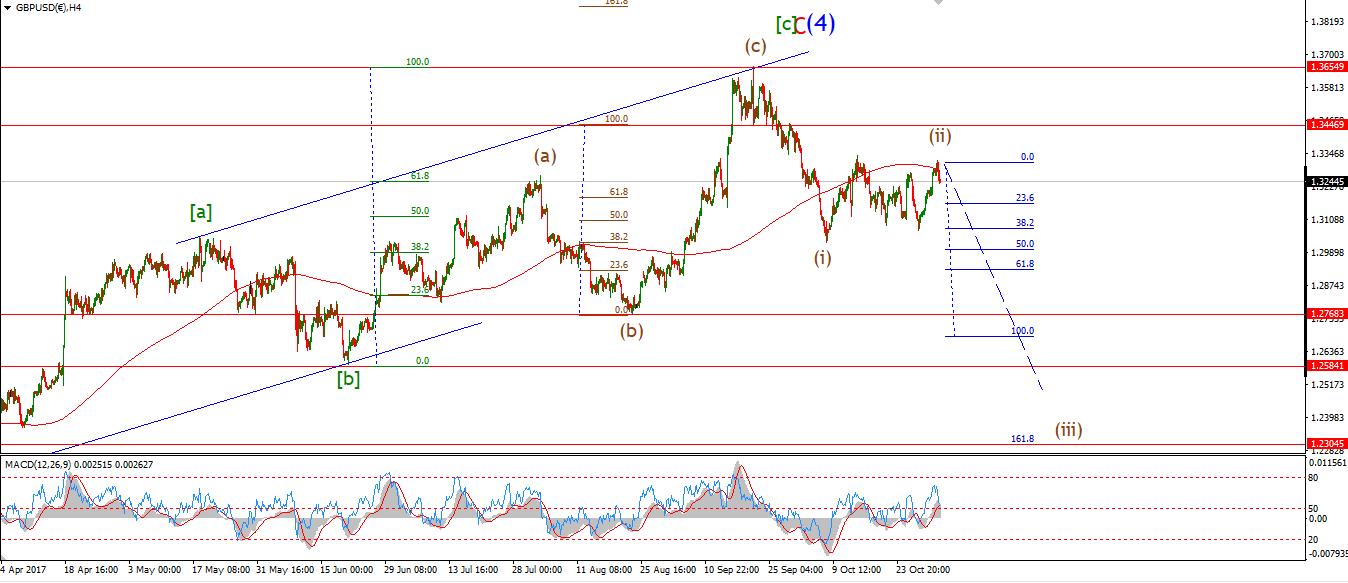
My Bias: short below parity in wave (5).
Wave Structure: continuing impulsive structure to the downside in wave (5)
Long term wave count: decline in wave (5) blue, below parity
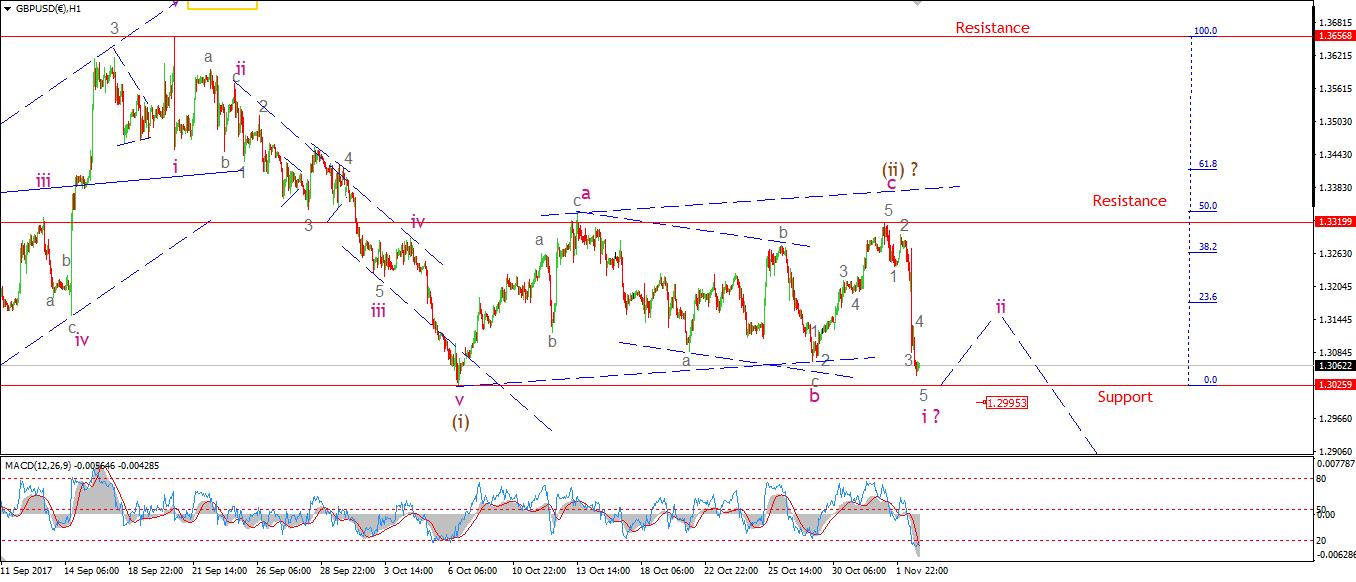
After calling the top in a possible wave (ii) brown Wednesday night at 1.3319. The price tumbled 250 points on Thursday!
The idea of a running flat wave (ii) seems to be confirmed now. And today's sharp decline is the beginning of wave 'iii' of (iii).
1.3319 now becomes key resistance on the short term chart.
The price seems to have traced out a five wave pattern into today's lows, I have labeled this wave 'i' down. A break of support at 1.3025 will add significant weight to the short-term wave count.
For next week, watch for a three wave recovery in a possible wave 'ii' pink. That should complete another bearish elliott wave signal in cable, the outlook remains solidly negative for now.
USDJPY
30 min
(Click on image to enlarge)
4 Hours
(Click on image to enlarge)
Daily
(Click on image to enlarge)
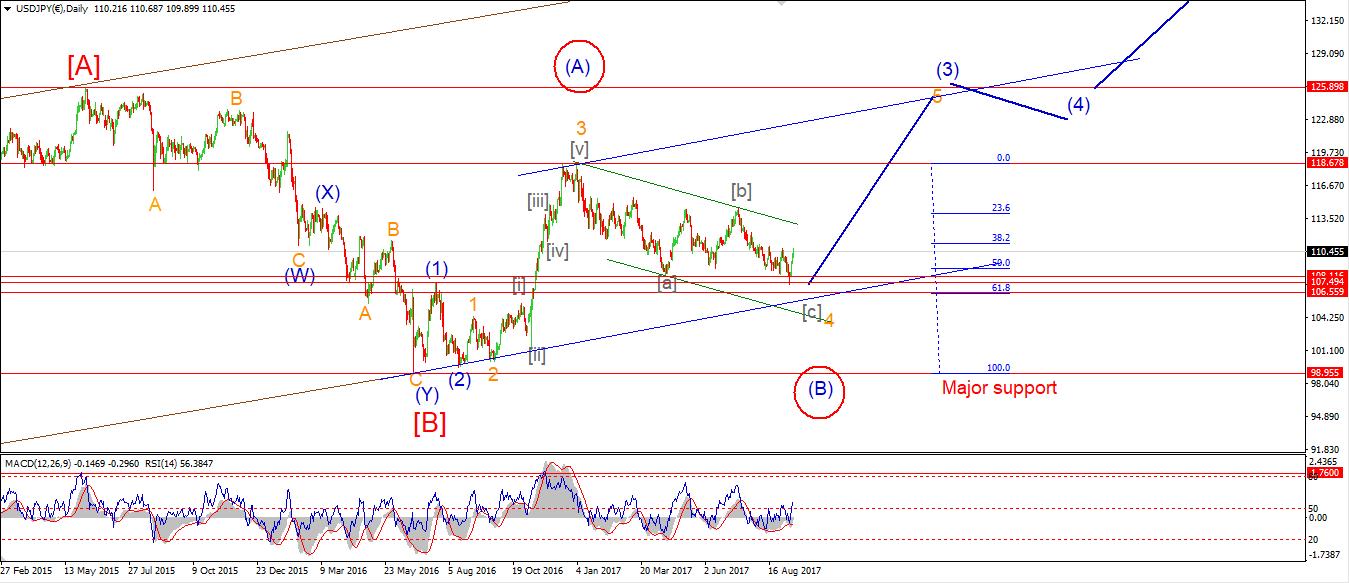
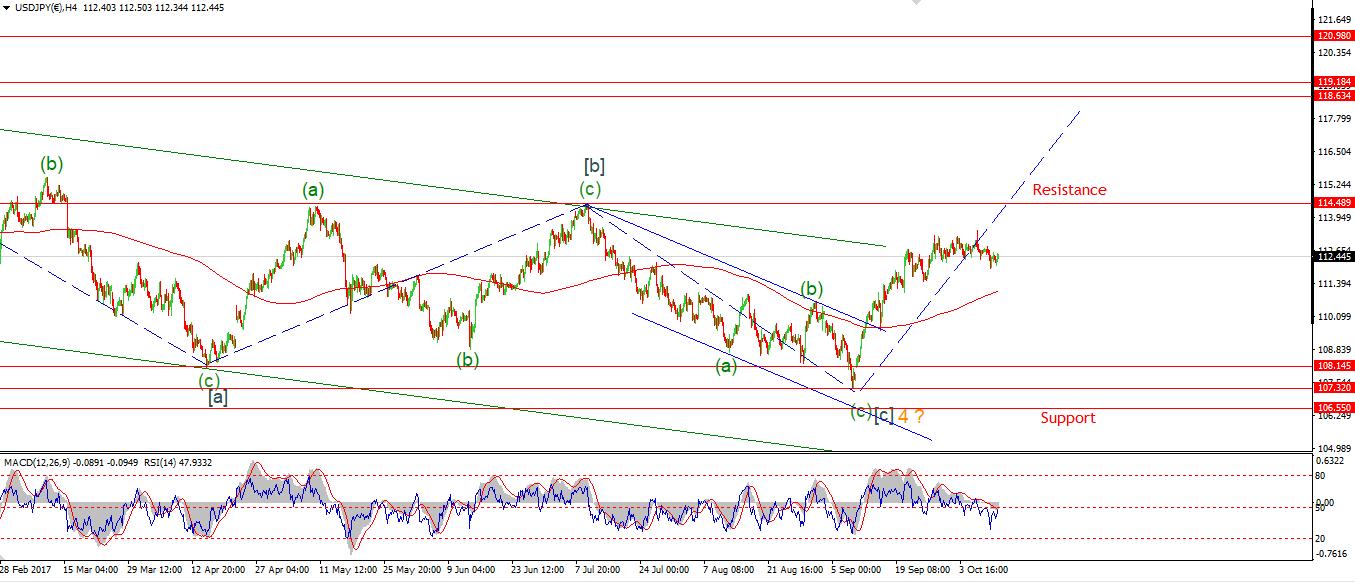
My Bias: LONG
Wave Structure: rally in wave [C]
Long-term wave count: wave [C] is underway, upside to above 136.00
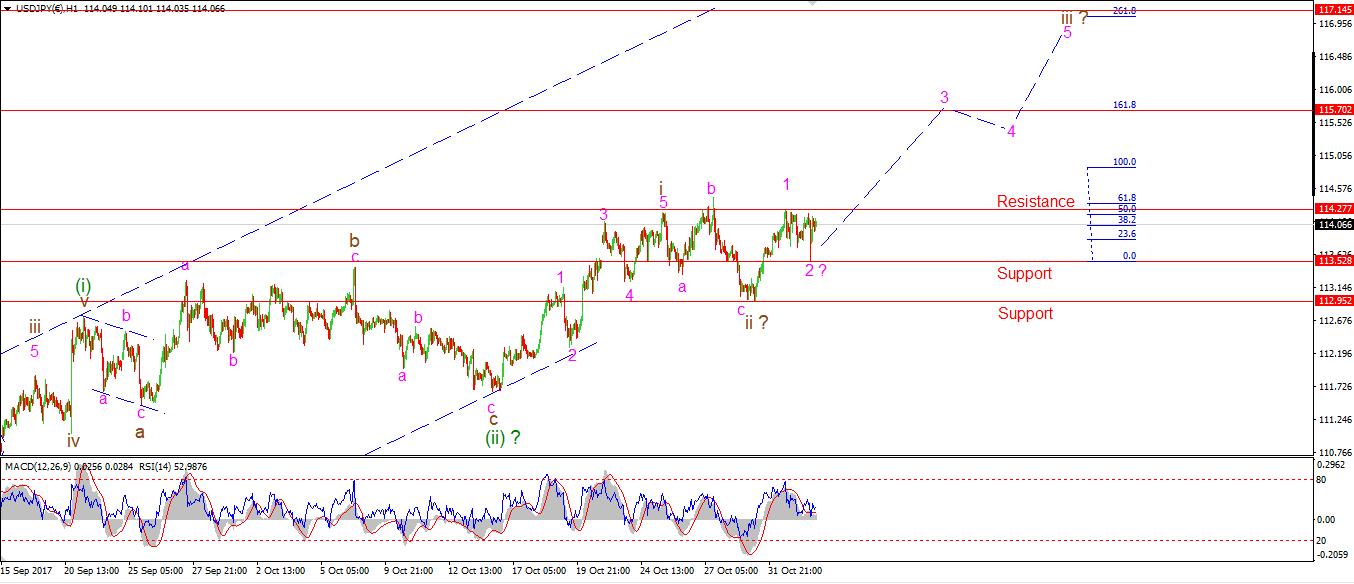
As expected, USDJPY corrected in a wave '2' pink today. The decline was very choppy and made zero net gain so it qualifies as a corrective form.
The price has again bounced higher this evening in a possible wave '3' pink. The Fibonacci projection for wave '3' lies at 115.70. With support at 113.52, a break of the wave '1' high will confirm the beginning of wave '3'.
For tomorrow: 113.52 should hold from here on. 114.27 is the price to watch to confirm wave '3' has begun. The price could rally quickly from here as it is a possible wave '3' of 'iii' of (iii).
Gold
30 min
(Click on image to enlarge)
4 Hours
(Click on image to enlarge)
Daily
(Click on image to enlarge)
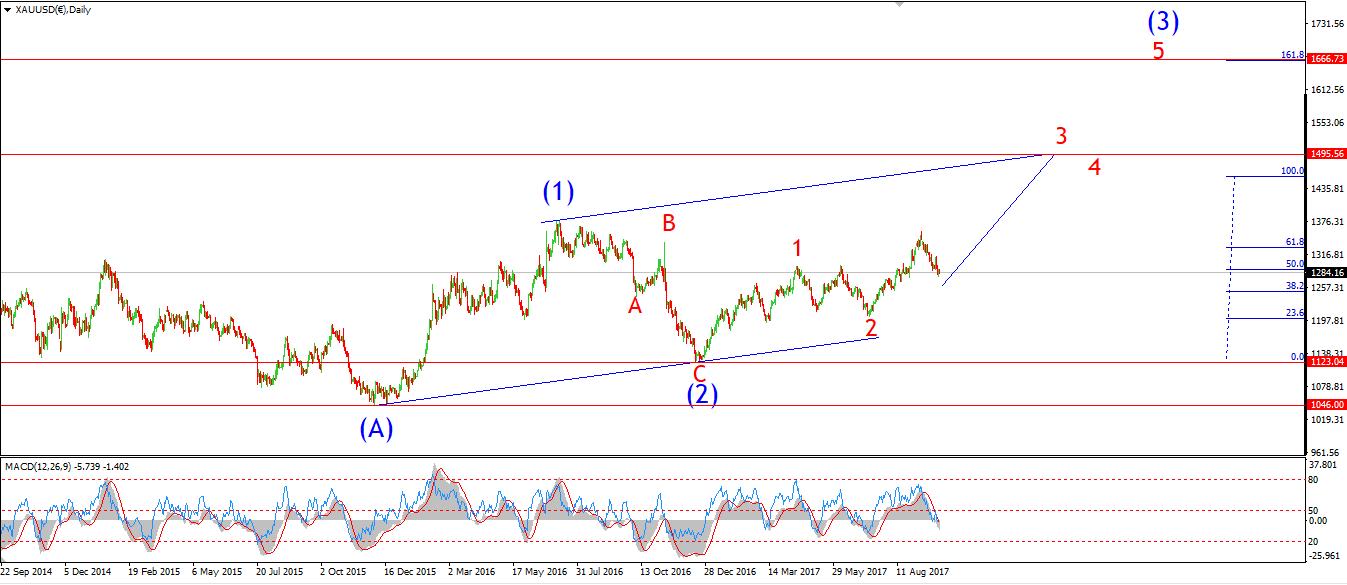
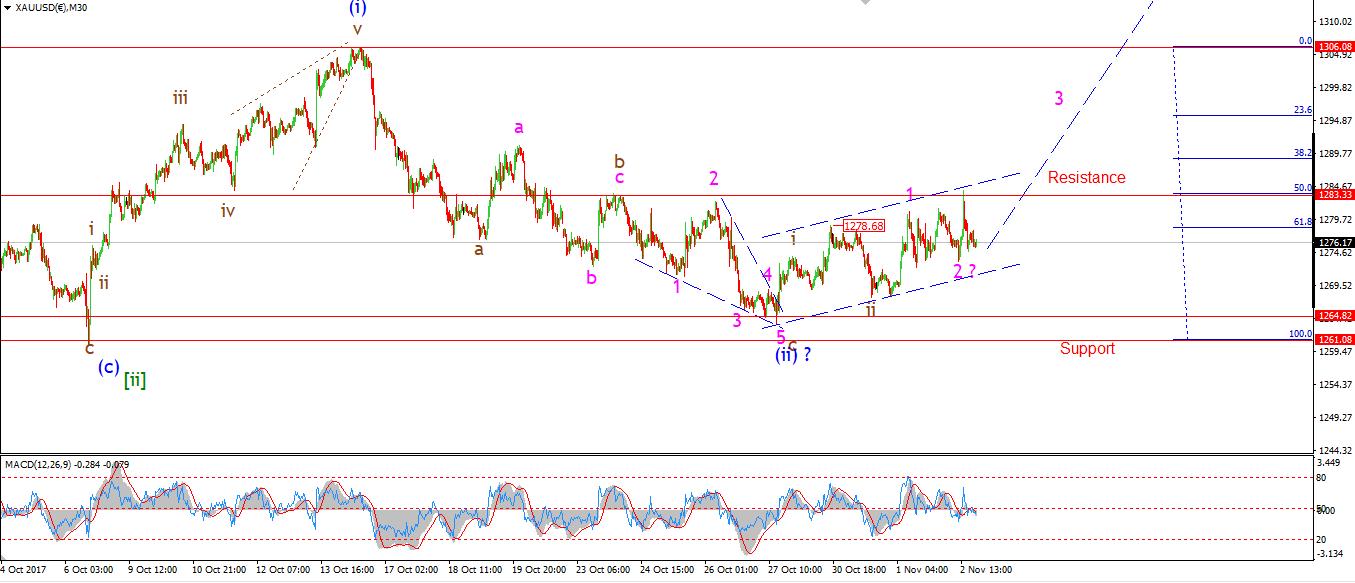
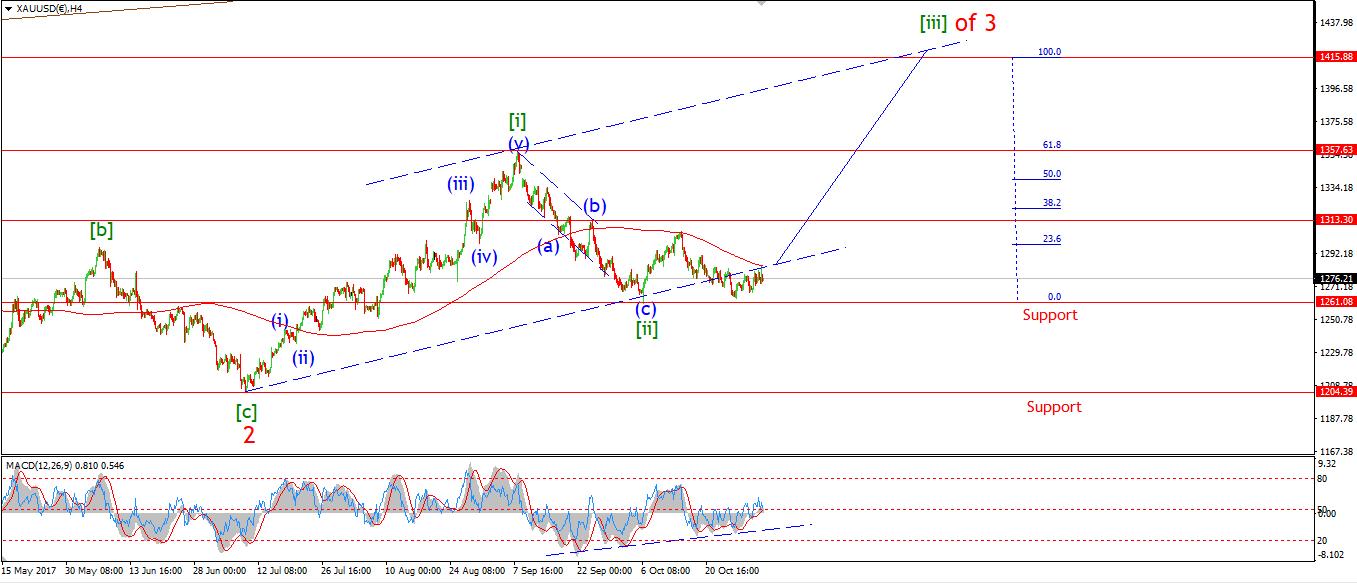
My Bias: Long to a new all-time high above 1827.
Wave Structure: Impulse structure to a new high.
Long-term wave count: wave (3) above 1666.
On the 4hr chart, the price actually met the 200MA today with that spike in at the U.S open. So we sit at an interesting juncture in the price structure right now. I want to see the price break up through that 200MA and start to use it as support from here. Also on the 4hr chart. The MACD is on the verge of a bullish momentum signal, As it is about to break up above the centreline.
On the short term chart, the spike higher today may be the beginning of wave '3' pink. If that is the case, then today's low at 1273.96 must hold as wave '3' develops.
For tomorrow: 1283 remains key resistance in the short term. A solid break above that line will be redeem the bullish short term count.
Want to know the next big move in the Dollar, GOLD and the DOW?
Check out our membership plan over at ...
more

