
Going, Not Gone
The ability to choose our goods and services is fundamental to economics. The freer we are to make choices, the more the economy should prosper. That’s because our choices tell producers what works.
Modern science muddies this pleasantly clear water. Behavioral economists talk about a phenomenon called “decision fatigue.” It turns out we humans would really rather avoid choices. Confronting a store shelf with 70 different kinds of toothpaste is no one’s idea of freedom. We just want toothpaste. Tell us what works (I have been buying the same toothpaste for decades. It’s not well advertised, but I tried it because it had baking soda I remembered using as a kid. Never mind the other choices).
As the world throws more choice at us, our brains fight back with binary thinking. We want everything to be on or off, black or white, high or low. This saves mental energy, but often leads us to suboptimal if not wrong choices.
Binary thinking abounds in the ongoing inflation discussion. A lot of commentary pretends we have either terrible inflation or no inflation at all. But in reality, we have degrees of inflation. It’s not a yes/no thing. Describing it requires literally a million shades of grey (forget about merely 50).
A daunting thought, I know. I apologize for imposing it on your decision-fatigued brain. But I can still simplify it for you. The inflation picture is getting better, but we still have too much of it. Inflation is going but not gone, and it probably won’t be gone anytime soon. Today, I’ll tell you why.
Restored Balance
The latest Consumer Price Index, which covered June, came out on July 11. It was a little better than expected—the 12-month CPI change was 3% while core CPI (excluding food and energy) was up 3.3%. Still significant, but far better than the 9.1% headline rate we were running two years ago.
As you can see in this chart, annual CPI is now roughly where it was in the 2005‒2006 period. But that’s still a higher rate than prevailed for most of the last 20 years.
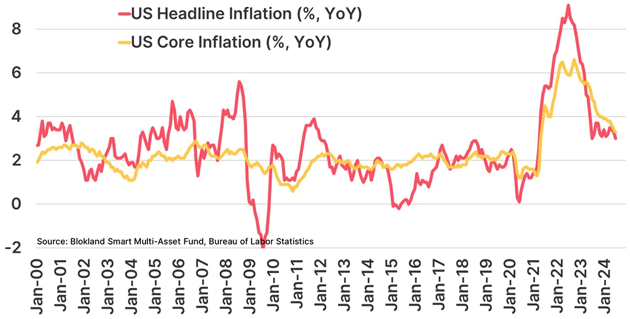
Source: Jeroen Blokland
Obviously, one month is just one month. But a single month can still be significant when it shows a notable change. This one does. Looking only at the month-over-month difference, CPI’s -0.1% change from May to June was the first significant disinflation since May 2020, when much of the economy was on a COVID-19 hiatus.
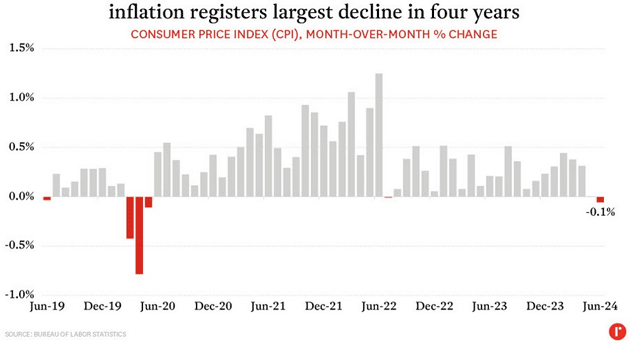
Source: rennie
A few more months in this zone (or even a little above it) would be an important change. There is some reason to think that could happen. My friend Dave Rosenberg recently shared some Census Bureau data I’d not seen before. Their Quarterly Survey of Plant Capacity Utilization (“QPC”) monitors whether the US manufacturing and publishing sectors are operating at full capacity.
The QPC is partly a defense project, keeping tabs on whether the private sector can respond to emergencies. But it tells us something about inflation, too. Here's the latest.
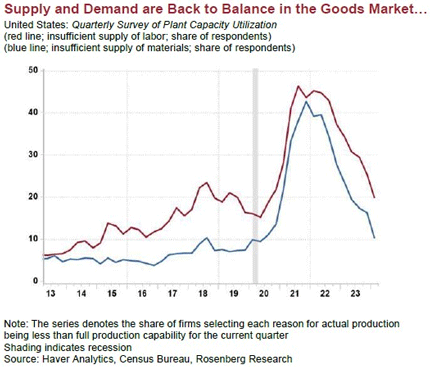
Source: Rosenberg Research
Basically, the Census Bureau asks companies if they are using all their productive capacity, and if not, why not? The red line in the chart is the share of companies saying insufficient labor is holding down production. The blue line is insufficient materials.
Notice how the red labor line started rising long before the COVID-19 recession. That reflects the labor supply tightening as the Baby Boom generation began reaching retirement age. Material shortages were mostly steady until 2020, when both lines shot way up.
Last quarter’s QPC reading shows both labor and material constraints are approximately back where they were in 2019. This suggests the COVID-era manufacturing disruptions have largely run their course.
Dave also shared similar data for labor. This chart shows the ratio of job openings to the available labor supply. It, too, is back down to the pre-COVID normal.
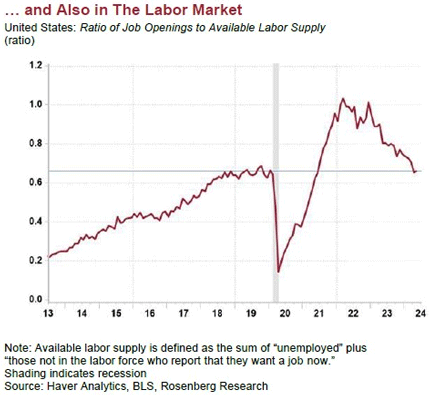
Source: Rosenberg Research
As of last month, the economy had 0.66 open jobs per available worker, which would mean “slack” in the labor market. It’s not that simple, of course; not every available worker is qualified for every job, or located in the same place where jobs are available. Many employers still can’t find the help they need.
We should also note that the 2019 situation wasn’t great. Even back then, many employers were complaining they couldn’t find enough workers. Directionally speaking, though, this data suggests inflation really is softening.
But there’s more to this story.
Core Problem
When you look at data like the QPC and employment numbers shown above, it’s important to remember they are survey data. The agencies don’t measure observable conditions. They just ask questions, which people answer based on their own knowledge, but also their own biases. It is an inherently subjective methodology, which can lead you wrong.
We see the same in political polling, by the way. I’ve always taken them with a grain of salt, but now I use a good part of the saltshaker. That’s not necessarily manipulation or dishonesty. It’s just increasingly hard to get a representative sample when people don’t answer their phones because we all get so many spam calls.
I haven’t had a landline in decades and neither do many people who should be in those polls. It is a very difficult business. And there’s still the normal problem of wording the questions just right, which can make a significant difference. So, it’s good to consider other kinds of data, too.
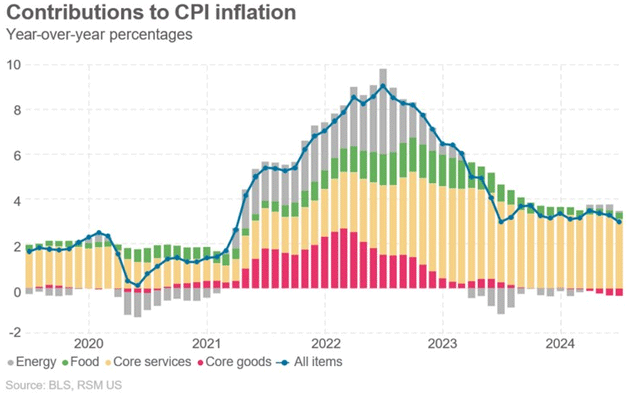
This chart from RSM shows the annualized CPI inflation rate by month, with each bar colored to reflect the portion attributable to energy, food, core services, and core goods. The way these have evolved since 2020 is revealing.
Source: RSM
In 2020, price inflation was found mostly in food and core services, offset by weakness in energy and core goods. It’s easy to see why. People weren’t driving or traveling, which kept energy prices down, while health policies reduced core services supply. It summed up to CPI running well below 2% for most of that year.
This flipped in early 2021 as energy and core goods prices surged. Food and core goods rose more slowly, but that changed as the year ended. Then came the Ukraine war and the Fed’s rate hikes.
For a few months, everything was rising fast. Energy, food, and core goods price increases slowly tailed off. Core service prices kept growing, and that’s where we are now. CPI growth now consists almost entirely of core services. The other three categories are barely visible.
In other words, today’s inflation isn’t about energy, or food, or anything tangible you can buy. Those things did get more expensive and haven’t gone back down, for sure. Inflation is cumulative; the fact that prices rose a lot and haven’t gone back down isn’t great. But the price growth seems to have stabilized for many goods. That’s progress—though, of course, your mileage may vary. There’s a lot of local variation.
If you are a Federal Reserve official whose job is to fight inflation, you look at this for guidance on what to fight. CPI inflation (and their other benchmark, PCE) has flattened over the last year, but is still too high. To move the needle any further, you must address the yellow part of those bars, the core services inflation which is holding stubbornly high. How do you do that?
To answer, we have to ask what is in that “core services” category. It includes a long list of small things and three larger ones: shelter, healthcare, and transportation. Shelter is by far the largest. Rent, owner’s equivalent rent, and some related expense categories account for about 60% of those yellow areas.
This means, assuming everything else holds steady, inflation can’t fall much further unless housing prices soften, and not just a little bit. What are the prospects for that?
Sticky Wicket
Housing prices, like anything else, are a function of supply and demand. Unraveling what that means is hideously complicated because housing is such a huge and complicated market. Arguably, it’s not “a” market at all. It’s many thousands of smaller markets based on location, property type, price range, and more.
Nonetheless, it is generally true housing demand has outstripped housing supply almost everywhere in the US. Higher prices are the natural result. These are more apparent in rental rates than purchases since leases end relatively often, usually within a year or two.
Torsten Sløk shared this interesting housing inventory chart, expressed in per-person terms. Shown this way, supply peaked in 2008 then began a long, gentle downturn which is still underway, though it did slow a bit after 2020.
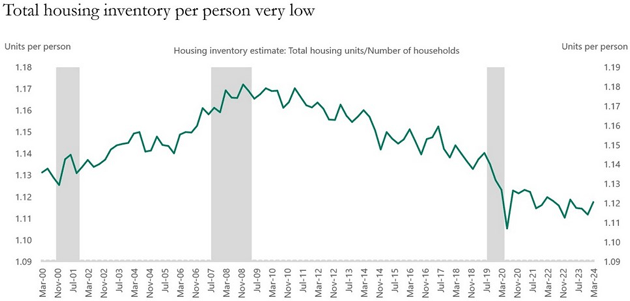
Source: Apollo Global
One challenge is that family sizes are shrinking, meaning we need more units of housing for the same number of people. Instead, we are getting less. The number of units under construction is actually shrinking, too.
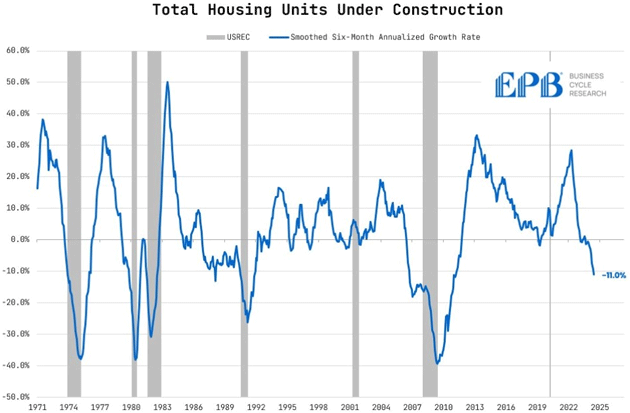
Source: Eric Basmajian
This is a sticky wicket, as my British friends say. Builders have no incentive to construct new homes unless someone can afford to buy or rent them. High mortgage rates make that difficult, while high labor and material prices make reducing prices difficult. Building smaller homes in different locations might help, but local rules often prevent it. The anti-development “NIMBY” (Not in My Back Yard) attitude is a real problem in many areas.
The Fed has little power to change this. It doesn’t directly control mortgage rates and even if it did, mortgage rates aren’t the only problem. Housing in the US has become a kind of frozen market. A bunch of people want to buy or lease homes, a bunch more have homes they would like to sell or lease, but they can’t find a market-clearing equilibrium.
Given enough time, markets almost always find equilibrium. I suspect this one will, too, but it could take a long time. Real estate is a slow-moving sector by nature. It’s more so now as construction takes longer and everything costs more.
But if housing prices don’t budge, neither will core services inflation. Barring some collapse in food and energy prices, that means overall inflation can’t fall much more from here. This is as good as it gets.
Worse, what if housing prices move up again? Here’s part of my friend Peter Boockvar’s report on this week’s housing starts report:
“Bottom-line, single-family builds are slowing as prices stay expensive, notwithstanding discounting and inventories have built to over 9 months as seen in the new home sales data (covering the different stages of completion). Multifamily starts and permits are back to their pre-Covid trend but well below the post COVID spike. I expect apartment rents to continue to slow this year and into most of 2025 as so much supply needs to get absorbed but inflect much higher again in 2026 due to the slowdown in supply while tenant absorption continues on because it's so pricy to buy a home for younger people.”
Note carefully: A slowdown in rent growth doesn’t mean lower rent. It means rent is still rising, just not as fast. The many, many young workers and families who can’t find affordable housing will get little relief (I have eight kids and their friends. I get plenty of feedback on this every month and especially when they move or their rent goes up, keeping me grounded in middle-class reality). They will keep couch-surfing, spend unwise amounts on rent (leaving less for everything else), or otherwise find that the “American Dream” doesn’t include them.
Inflation running around 3% ought to be manageable. It was that high or higher for most of my youth. Somehow, we got by. But many necessities—housing, education, healthcare, transportation, to name a few—weren’t nearly as expensive then. Dealing with it now is tough, especially on an entry-level income. I get why the younger generations are unhappy.
Meanwhile, government debt is growing, and inflation doesn’t seem likely to fall enough to make much difference in interest rates. Lacy Hunt continues to tell us this will weigh on GDP growth and keep inflation low. How low? That’s hard to say. And I’m struggling to see how even a recession would make apartment rent and home prices break significantly lower, although recessions have very real impacts on inflation for not good reasons. That is one reason the Federal Reserve has been cautious. Pushing the economy into a recession might solve the inflation problem in the wrong way.
That indicates getting inflation back to 2% will be very difficult, because of the impact of services. We may look back at those years of sub-2% CPI (and even a “1-handle” at times) as a wild aberration that could never persist. The only question was how it would end. We will now see the answer.
More By This Author:
Meditations on IndependenceDebtors and Creditors
This Time Is (Not) Different


