GDP Is Not A Predictor Of Stock Market Performance
There may be no correlation between economic growth (GDP) and the stock market in the US; and in China too, as Joshua M Brown shows below. This is because GDP only partially reflects corporate earnings and because earnings are only one factor affecting the performance of the stock market. So what of the frenetic trading around the weekly and monthly economic reports? A lot of noise.

In fact, Rainfall is a better predictor of the stock market than GDP. Will Deener writes:
Vanguard examined U.S. stock returns back to 1926 to assess the impact of more than a dozen metrics on the market. Researchers looked at such things as stock valuations (price-to-earnings ratios), economic growth, dividend yields and even rainfall to determine if they were predictors of future stock returns.
Economic growth, or gross domestic product (GDP), showed zero correlation, meaning it has no predictive value in determining future stock values.
On the correlation scale where 1.0 represented very strong predictability, GDP came in at 0.0 — the same level as the trailing 12-month stock returns. Rainfall at least came in at 0.06 on the scale.
“Many popular signals [that investors watch] have had a lower correlation with the future return of stocks than rainfall — a metric few would link to Wall Street performance,” the Vanguard researchers said.
The strongest link
The metric with the highest correlation was p/e ratios at 0.43. In other words, one of the best predictors of stock market performance, say, over the next 10 years, is the starting valuation at the beginning of the period — and the lower the better.
“The starting valuation decides just about everything,” said Pat Dorsey, president of Sanibel Captiva Investment Advisors in Chicago. “GDP tells you nothing about what the market will do.”
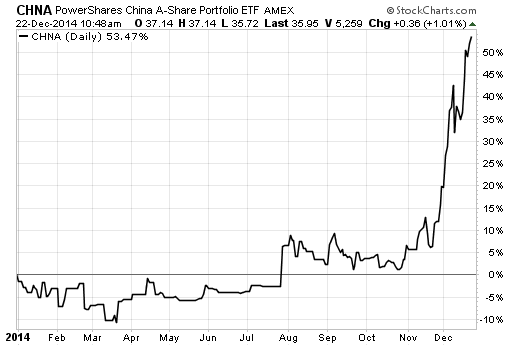
In Tell me more of your economic theories, Joshua M Brown shows that the connection between GDP and the stock market in China is not any better. If there is any correlation at all, it would probably be negative. Look at the CHNA chart below:
Tell me more of your theories about Chinese GDP growth and its impact on stock prices…
January 2014:
April 2014:
October 2014:
Chinese stock market, 2014:
(Article.)
Zero Hedge put this in perspective with a cartoon about the “economic growth” in the U.S. US Economic Growth (Summarized In 1 Cartoon):
“Presented with no comment…” ZH
Source: Cagle Post via Sunday Funnies
More on GDP from Investopedia (What is GDP and why is it so important?):
Answer:
The gross domestic product (GDP) is one the primary indicators used to gauge the health of a country’s economy. It represents the total dollar value of all goods and services produced over a specific time period – you can think of it as the size of the economy. Usually, GDP is expressed as a comparison to the previous quarter or year. For example, if the year-to-year GDP is up 3%, this is thought to mean that the economy has grown by 3% over the last year.
Measuring GDP is complicated (which is why we leave it to the economists), but at its most basic, the calculation can be done in one of two ways: either by adding up what everyone earned in a year (income approach), or by adding up what everyone spent (expenditure method). Logically, both measures should arrive at roughly the same total.
[…]
A significant change in GDP, whether up or down, usually has a significant effect on the stock market. It’s not hard to understand why: a bad economy usually means lower profits for companies, which in turn means lower stock prices…
Rainfall picture via Pixabay.
Visit Ilene at Market Shadows and sign up for the Market Shadows newsletter.
Disclaimer: I do ...
more


