
GBP/USD Weekly Forecast: Tumbles To 7-Week Lows, Eyes On NFP
Photo by Colin Watts on Unsplash
The GBP/USD weekly forecast has turned bearish after the price significantly declined last week, reaching 7-week lows near 1.3320. The move was attributed to a stronger dollar after a cautious Fed and upbeat data.
A broad US dollar resurgence followed stronger-than-expected US GDP growth, a recovery in durable goods orders, and a decline in jobless claims. This reinforced the view that the Federal Reserve may not deliver aggressive rate cuts this year. The Fed’s cautious tone was echoed by Fed Chair Powell and other policymakers, which further pushed the greenback up.
On the other hand, softer UK PMI data revealed slower growth momentum, further weighing on the demand for the pound. The Composite PMI fell to 51.0 in September from 53.5 in August, underscoring the fragility of the UK economy. Weaker gilt demand and political uncertainty also kept the sterling subdued.
The Friday’s Core PCE Inflation data came as expected at 2.9% y/y; the lack of upside surprise and a mildly better risk mode helped the GBP/USD stabilize into the weekend. However, the broader sentiment remains favorable for the US dollar as markets scale back bets for quicker Fed easing, while the Bank of England retains its cautious stance.
GBP/USD Key Events Next Week
(Click on image to enlarge)
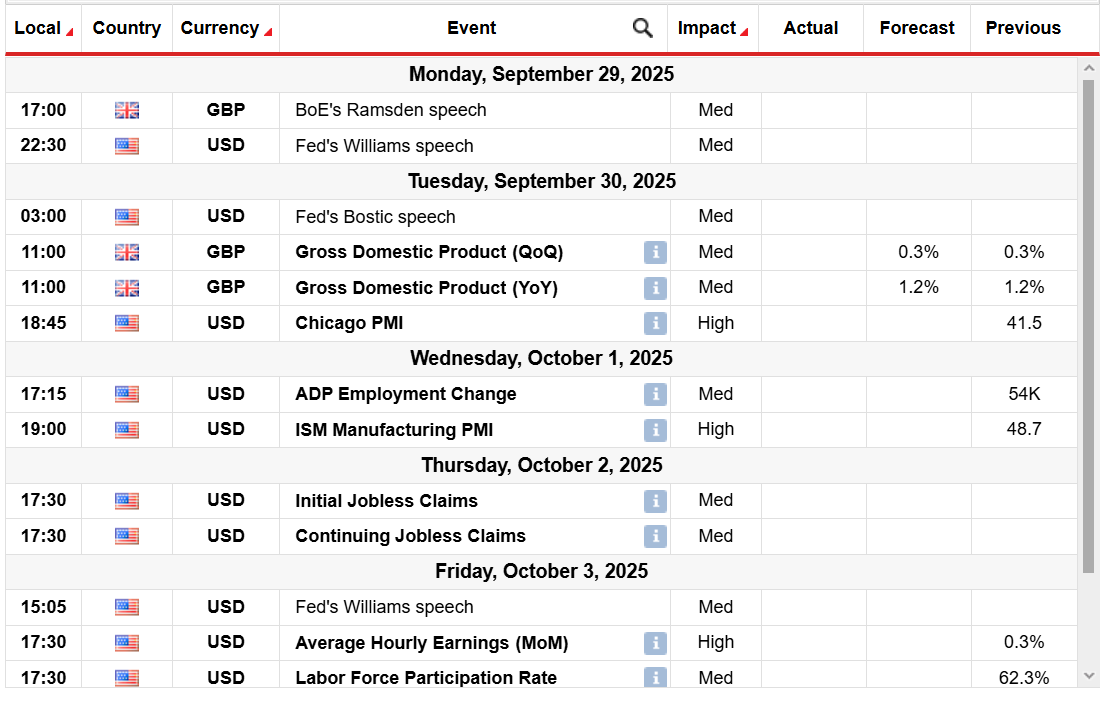
GBP/USD weekly key events
Moving to the last week of the month, the focus now shifts to the US labor market and the UK growth data, with the following significant events:
- UK GDP (Tuesday)
- JOLTs Job Opening (Tuesday)
- ADP Employment Change (Wednesday)
- US Non-Farm Payroll (Friday)
Another round of strong US data could further undermine the GBP/USD, while cooling labor market signs could dampen the dollar’s recovery. Traders will also monitor speeches by the Fed and BOE for fresh policy cues, along with tariff-related developments from the US.
GBP/USD Weekly Technical Forecast: Demand Zone Resisting Bears
(Click on image to enlarge)
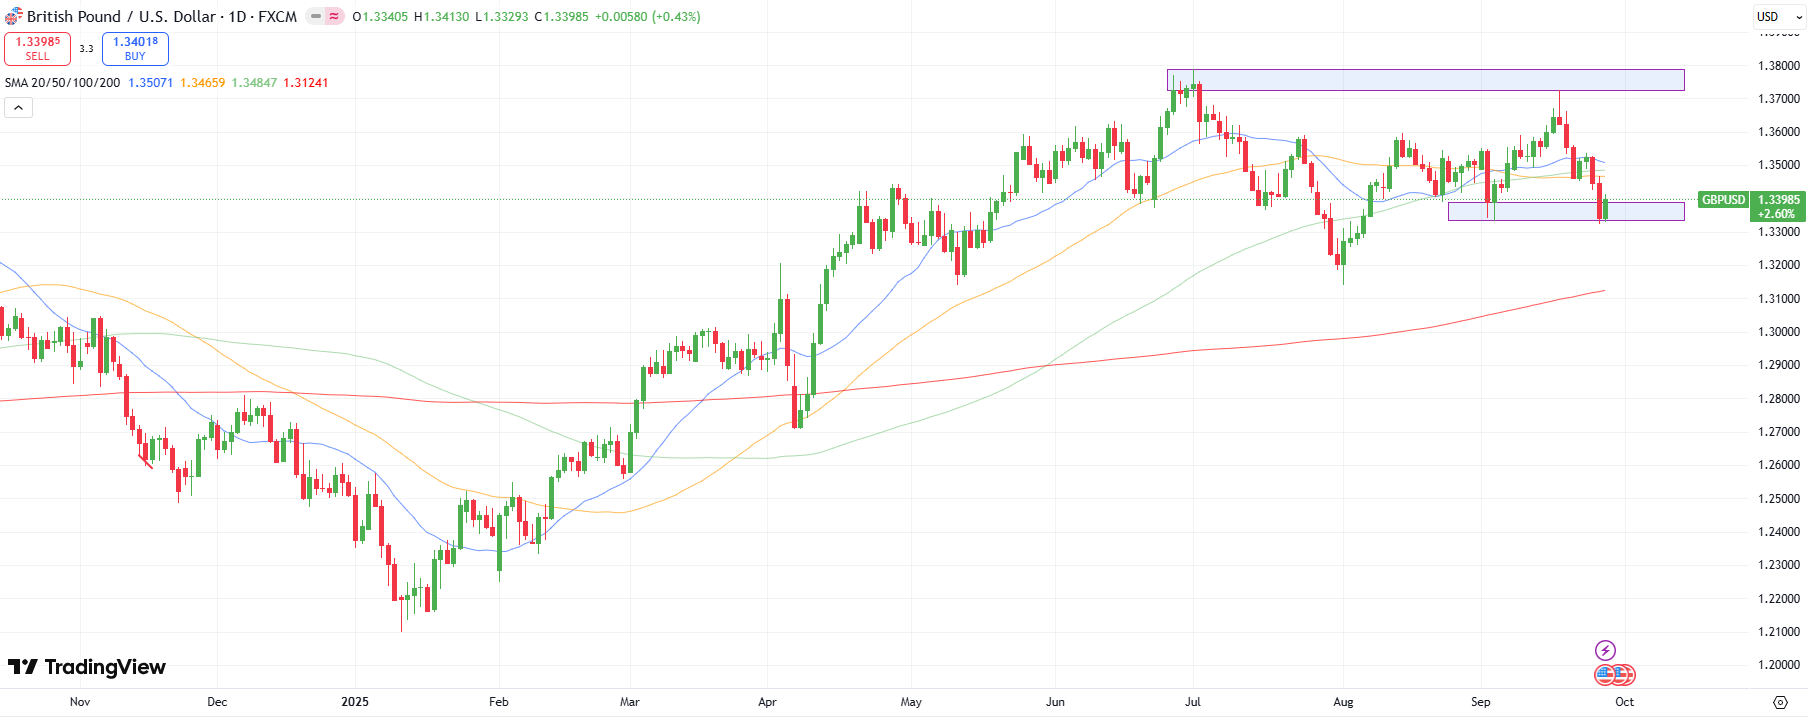
GBP/USD daily chart
The daily chart for the GBP/USD reveals a neutral to bearish bias, as the downside meets solid support at 1.3340, with the price jumping to the 1.3400 mark while closing the week. However, the prices are lying well below the key moving averages, which could gather selling traction, pushing towards the 200-day MA at 1.3125. This needs a clear breakout of the demand zone.
On the other hand, if the prices remain supported by the demand zone, the pound could further gain and test the MA confluence zone at 1.3480–1.3500. The markets are likely to consolidate, awaiting fresh impetus.
More By This Author:
GBP/USD Outlook: BoE Caution Meets Stronger US Data
Gold Outlook Softens From All-Time Highs Amid Cautious Fed
EUR/USD Price Slips Below 1.1750 Amid Dismal German Data
Disclaimer: Foreign exchange (Forex) trading carries a high level of risk and may not be suitable for all investors. The risk grows as the leverage is higher. Investment objectives, risk ...
more

