
The dollar is caught in the sway of softer inflation signals and continues its decline, casting a favorable glow on the GBP/USD weekly forecast.
Ups and downs of GBP/USD
The pound ended the week slightly high, although it was nearly flat after fluctuating. It remained stable against the dollar, with traders absorbing the latest information on the UK budget deficit. Moreover, the impact of Wednesday’s November inflation data, which was lower than anticipated, continued to resonate in the market.
Thursday’s figures revealed a worsening budget situation for British Prime Minister Rishi Sunak, as the November deficit exceeded expectations. Notably, the pair fell on Wednesday to the lowest point in almost two months following the key inflation reading.
Meanwhile, the dollar index declined on Friday, reaching a nearly five-month low. This decline came after data showed that annual US inflation had further slowed below 3% in November. Consequently, it strengthened market expectations for a US interest rate cut in March.
Next week’s key events for GBP/USD
(Click on image to enlarge)
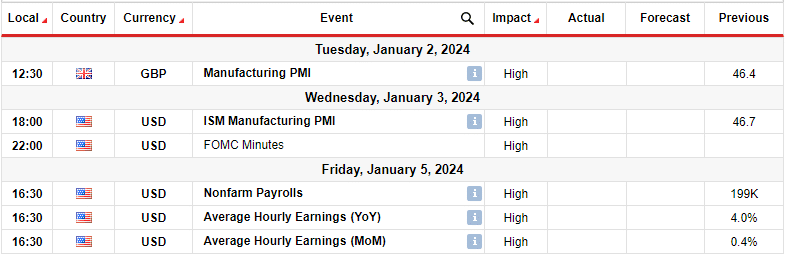
The markets will be closed for the Christmas holiday next week, so investors will look out for major events in the first week of 2024.
In the first week of 2024, traders will focus on data from the UK and the US, showing business activity in the manufacturing sectors. Additionally, the US will release the FOMC meeting minutes, which will show what policymakers discussed at the last meeting in 2023.
Lastly, the US employment report will show the state of the labor market. A higher-than-expected reading could reduce Fed rate cut bets, while the opposite is true.
GBP/USD weekly technical forecast: Bullish trend shows signs of a slowdown
(Click on image to enlarge)

GBP/USD daily chart
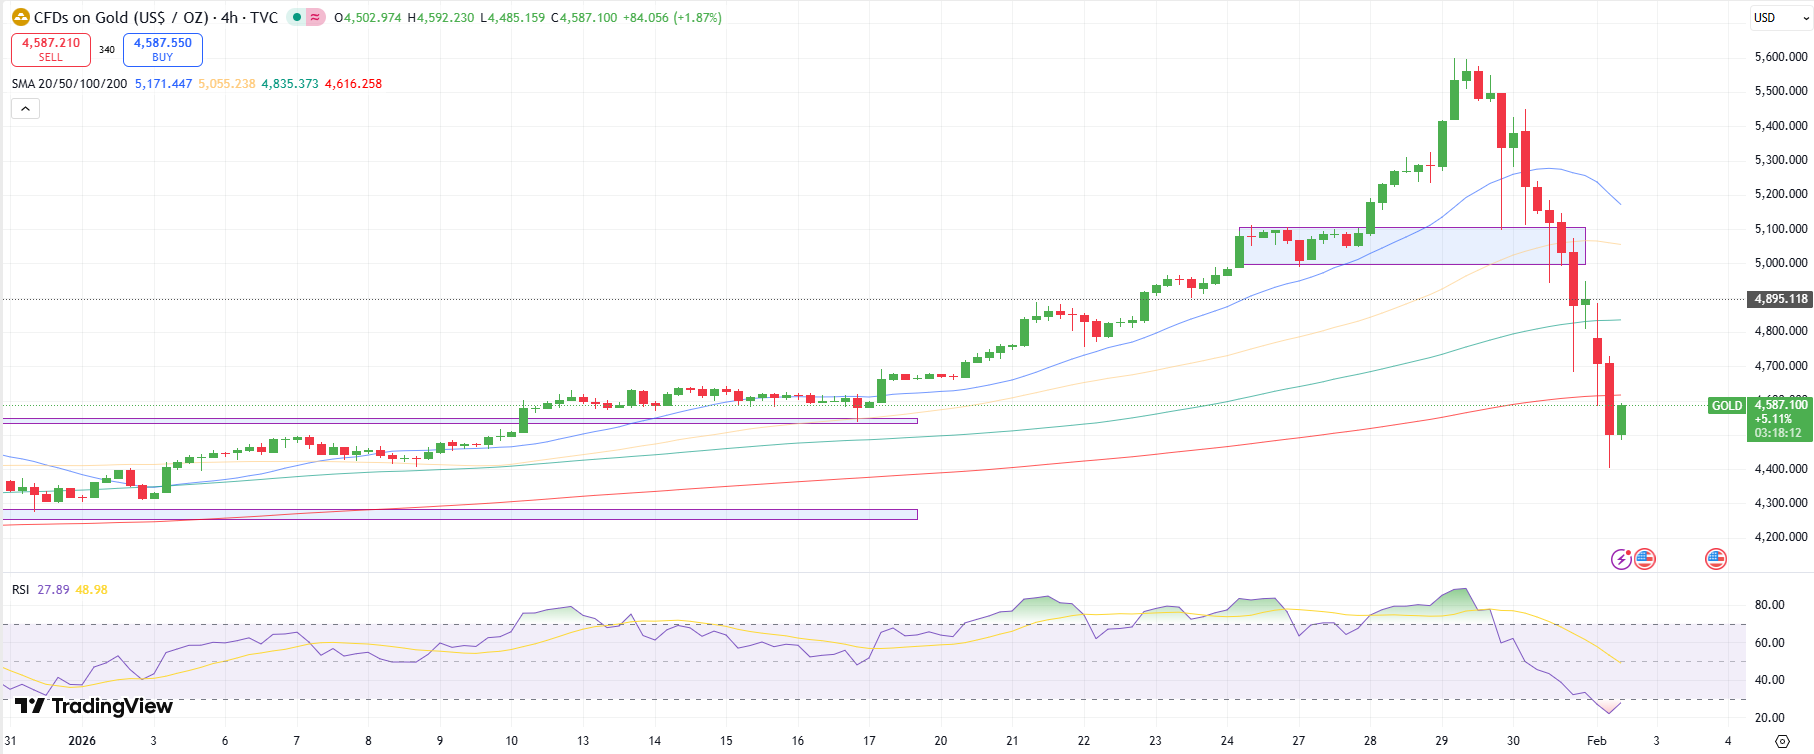
The bullish trend on the 4-hour chart has slowed down after reaching the 1.2803 resistance level. Moreover, the slope of the 22-SMA has become shallower, and the price is not making big swings from the SMA. At the same time, bears are showing some strength as they keep challenging the SMA support.
Meanwhile, the RSI has made a bearish divergence. While the price has made a new higher high, the RSI has made a lower high, pointing to weaker bullish momentum. Since the price is already trading close to the SMA support, the bearish divergence might lead to a reversal in the trend. However, bears must break below the 22-SMA and the 1.2501 support level to confirm a reversal.
More By This Author:
USD/CAD Weekly Forecast: BoC-Fed Divergence Favors BearsUSD/CAD Outlook: Dollar Near 4-Month Low Ahead of Inflation
EUR/USD Outlook: ECB Fails To Suppress Rate-Cut Bets

Comments
Log in or sign up to join the conversation.