
The GBP/USD weekly forecast shows a temporary pause in a solid bullish trend as investors await the first Fed rate cut while the US NFP gives no clear direction.
Ups and downs of GBP/USD
The pound had a bearish week, fluctuating amid mixed US economic data. Meanwhile, the UK provided few catalysts. Employment figures showed that the labor market is slowing down. Vacancies fell more than expected, and private job growth slowed.
Meanwhile, the nonfarm payrolls report showed a smaller-than-expected job increase in August. However, the unemployment rate held steady at 4.2%. Meanwhile, data on business activity in the services sector showed a better-than-expected improvement, indicating a resilient economy.
Next week’s key events for GBP/USD
(Click on image to enlarge)
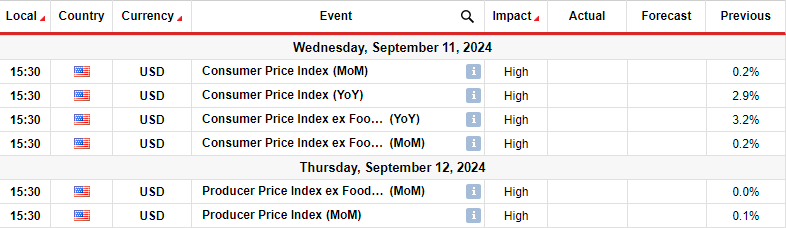
Next week, investors will pay attention to the UK’s employment and GDP data. Meanwhile, the US will release consumer and producer inflation data. The pound has benefitted in recent weeks due to expectations for fewer rate cuts in the UK compared to the US.
Therefore, if UK wage growth confirms fears that British services inflation remains high, BoE rate cut expectations might drop, boosting the pound. Moreover, the pound would rally, given the declining US labor market. The Fed is in a better position to start lowering borrowing costs.
Meanwhile, US inflation data will be the last major report before the Fed’s policy meeting. Softer-than-expected figures will increase the likelihood of a 50-bps rate cut.
GBP/USD weekly technical forecast: Bullish trend pauses for a brief pullback
(Click on image to enlarge)

GBP/USD daily chart
On the technical side, the GBP/USD price is in a bullish trend. Although the price chops through the 22-SMA, it has maintained an upward trajectory. This means it has made a series of higher highs and lows. At the same time, the RSI has traded mostly above 50, supporting solid bullish momentum.
Bulls recently broke above the critical resistance level of 1.3000. However, they failed to trade above the 1.3200 resistance, allowing bears to take charge. Nevertheless, the bullish bias remains intact since the price is still above the SMA. Therefore, the pullback will likely pause at the SMA and bounce higher. On the other hand, if it punctures the SMA and the 1.3000 level, it might find support at the bullish trendline. A new high above 1.3200 will continue the bullish trend.
More By This Author:
AUD/USD Forecast: Dollar Gains Amid Risk FlowsUSD/CAD Price Analysis: Buyers Emerge Amid Falling Oil
USD/CAD Weekly Forecast: Weak Economy Weighs On CAD

Comments
Log in or sign up to join the conversation.