GBP/USD: Weekly Forecast 24th September - 30th September
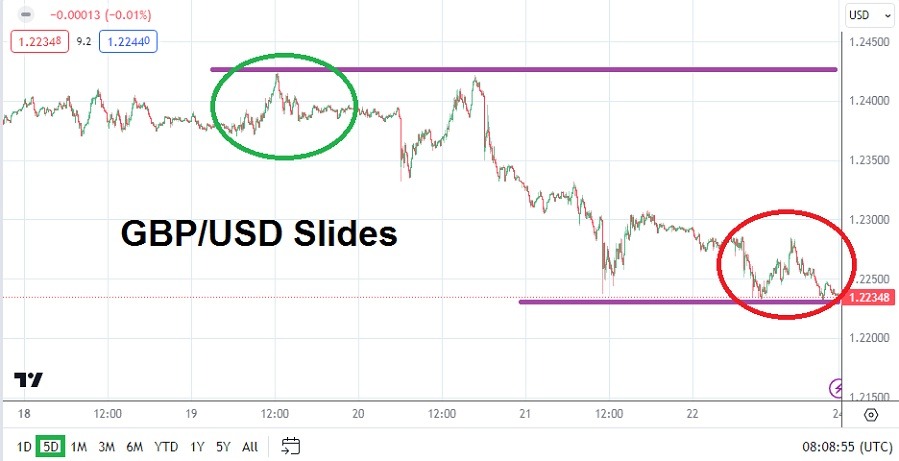
The GBP/USD high of last week near the 1.24250 mark on Tuesday and a brief retest of the level on Wednesday began to see rapid price velocity develop lower. The U.S. Federal Reserve gave a rather stern warning in the middle of last week that it intends on raising the Federal Funds Rate again, seemingly in November. The Bank of England on Thursday followed the Fed’s rhetoric with a ….. drumroll please ……a pause which surprised some analysts.
While the Bank of England certainly has shown some ‘backbone’ by not raising the Official Bank Rate last week, this as the European Central Bank did hike its Main Refinancing Rate the week prior, financial institutions used the BoE’s decision to start selling the GBP/USD with lust. The currency pair touched a low of nearly 1.22380 on Thursday. The selling did not stop, while reversals upwards were produced once and a while, by Friday the GBP/USD was testing the 1.22325 level.
The GBP/USD went into this weekend near the 1.22350 mark, failing to sustain much momentum upwards. Essentially financial institutions have priced in a weaker GBP/USD and their mid-term outlooks likely remain disgruntled. Day traders need to be careful as this week of trading gets ready to unfold, because the fireworks show in the GBP/USD may not be quite finished.
Important U.S. data coming this Thursday and it will impact the GBP/USD
This coming Thursday the U.S. will release its Gross Domestic Product numbers, if the growth statistics come in higher than anticipated it could spark additional short-term weakness in the GBP/USD. Traders who are intent on betting on an upward dose of momentum to suddenly develop and become sustained should remain cautious until the results of these GDP numbers are printed from the States.
And even if the GDP numbers are weaker than expected, GBP/USD traders should also monitor the price of WTI Crude Oil, because if the energy remains expensive it will spark fears about a renewed burst of stronger inflation in the U.S. Concerns about a rather stubbornly strong U.S economy and inflation remaining evident could spark additional GBP/USD selling.
Mid-Term Support Levels Technically of the GBP/USD Need Attention
- The GBP/USD is now trading near values it has not traversed since late March of 2023.
- July’s highs for the GBP/USD near the 1.31350 ratio feel like a distant memory.
- Support near the 1.22000 level may feel far away, but if it is challenged this week, prices in the GBP/USD could move lower, particularly if U.S GDP numbers are strong and the costs for WTI Crude Oil remain near or above 90.000 USD per barrel.
GBP/USD Weekly Outlook:
The speculative price range for GBP/USD is 1.20130 to 1.23690
The trend in the GBP/USD has been downward and financial institutions continue to react to concerns the U.S Federal Reserve may be kept in a position in which they have to remain vigilant regarding interest rates. The past week of trading saw fundamental actions by the central banks cause a massive reaction in Forex. The Bank of England’s decision not to protect the GBP by ‘pausing’ its interest rate as the Federal Reserve rattled its swords was a spark that caused price velocity to build.
The inability of the GBP/USD to create a reversal higher that could be sustained on Thursday and Friday highlights that additional selling pressure in the currency pair might develop early this week. Trading is likely to be nervous until Thursday’s Gross Domestic Product results from the U.S. and the GBP/USD will react to any surprise outcome of the growth data.
Traders looking for a reversal upwards to develop should be cautious and not overly ambitious regarding their targets. A sustained move upward is unlikely in the short term and should be deemed speculative until Thursday’s U.S. GDP numbers are known. The price velocity of the GBP/USD last week should be remembered and cautious trading is encouraged, even by traders who want to keep pursuing downward momentum. If the 1.22000 level is broken lower traders should monitor price velocity, if it is fast and lower values are being demonstrated the 1.21000 ratio could be seen.
(Click on image to enlarge)

More By This Author:
EUR/USD Technical Analysis: Testing Its Six-month Low
BTC/USD: Recent Upward Mobility Now Challenged By Headwinds
EUR/USD Technical Analysis: Fed Reserve Determines Euro Fate
Disclosure: DailyForex will not be held liable for any loss or damage resulting from reliance on the information contained within this website including market news, analysis, trading signals ...
more


