
The Pond Sterling retreated after rallying three consecutive days, dropping some 0.19% even though the UK’s jobs data was solid. Meanwhile, a hawkish tilt by Fed officials and US President Donald Trump's tariffs policies add to uncertainty, underpinning the Greenback. The GBP/USD trades at 1.2602.
Pound retreats despite upbear UK jobs data; traders await inflation data
In the UK, the economy added 107K people to the workforce, exceeding estimates of 50 K. Consequently, the Unemployment Rate in the fourth quarter stood steady at 4.4%, while pay growth, as revealed by Average weekly earnings before bonuses, jumped 5.9%.
Meanwhile, Fed Governor Christopher Waller crossed the wires on Monday, saying that Trump’s tariffs would have a modest impact on prices. His colleague Philadelphia Fed Patrick Harker said he doesn’t see a reason for an imminent change in interest-rate policy.
Harker’s view is closer to the hawkish comments revealed by Fed Chair Jerome Powell's semi-annual testimony to the US Congress, in which he reiterated that the Central Bank is in no rush to ease policy.
Traders currently see a 25-basis-point rate cut by July, though the odds for a December cut are at 80%, revealed Prime Market Terminal data.
(Click on image to enlarge)
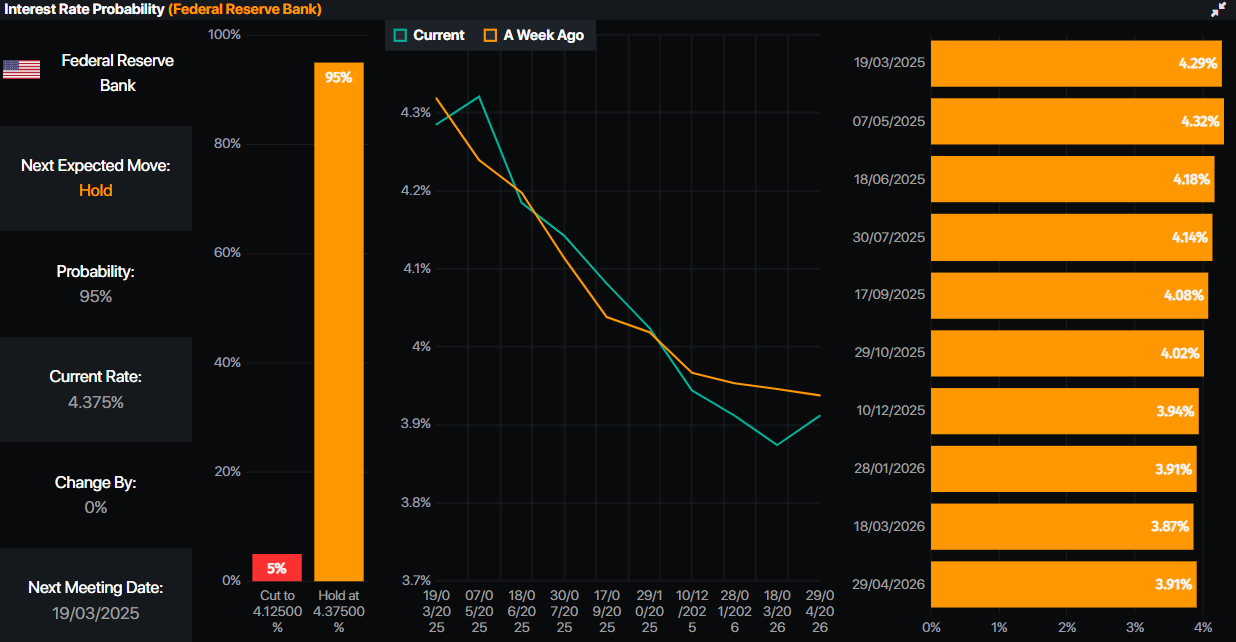
Source: Prime Market Terminal
In the meantime, the GBP/USD extended its losses as the US Dollar Index (DXY) gains 0.26% and reclaims the 107.00 mark.
Ahead of the day, Fed officials will continue to grab the headlines, though traders are awaiting the UK’s inflation data on February 19, US housing data, and the latest Federal Open Market Committee (FOMC) minutes.
GBP/USD Price Forecast: Technical outlook
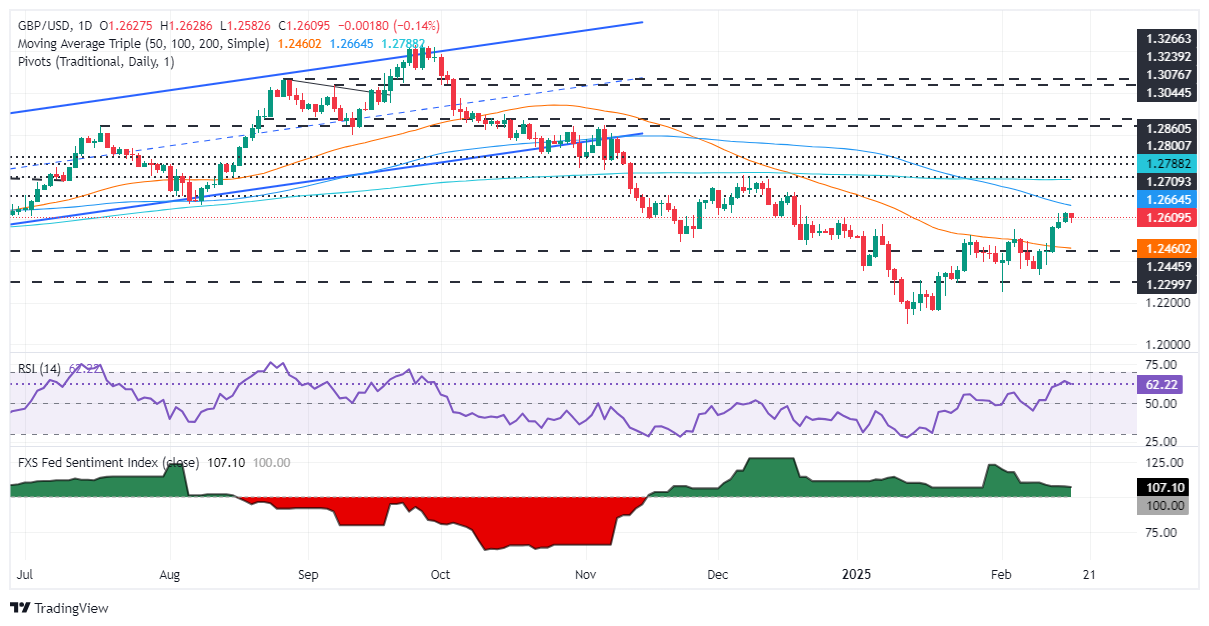
The GBP/USD is forming a ‘bearish harami’ two-candle chart pattern, which indicates that sellers could drive the exchange rate lower, setting t
heir sights below 1.2600. The Relative Strength Index (RSI) is bullish, though aiming slightly lower, indicating that the downside risks remain.
If GBP/USD tumbles below the February 17 low of 1.2577, look for a test of the February 5 high turned support at 1.2549, followed by the 50-day Simple Moving Average (SMA) at 1.2467. On the other hand, buyers need to drive the exchange rate past 1.2634 so they can challenge the 100-day SMA at 1.2678.
(Click on image to enlarge)
More By This Author:
Silver Price Forecast: XAG/USD Holds Firm, Negative Divergence Looms
Gold Prices Rise, Struggle To Clear $2,900
USD/JPY Price Forecast: Slips Below 152.00 As Bearish Momentum Builds


Comments
Log in or sign up to join the conversation.