GBP/USD Recovers Some Ground On Hot UK CPI Despite Strong U.S. Data

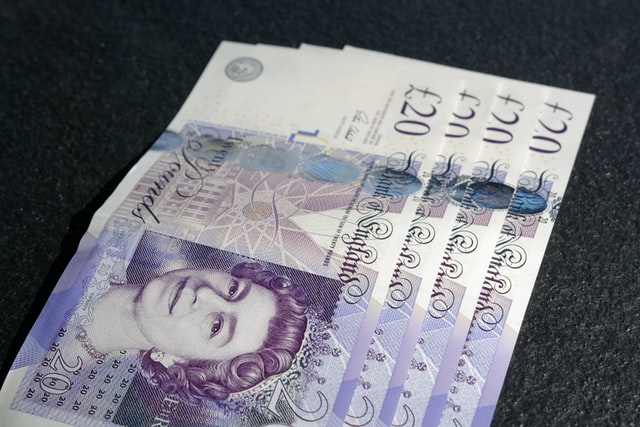
Photo by Colin Watts on Unsplash
The Pound Sterling (GBP) registered decent gains versus the US Dollar (USD) on Wednesday after a solid report from the Office for National Statistics (ONS) outshone US Retail Sales data for December. Nevertheless, not all has been said, as the GBP/USD pared some of its gains, but it remains up 0.25%, at 1.2667, after hitting a low of 1.2596.
Jump in UK inflation, could deter the BoE from cutting rates, a tailwind for GBP/USD
Data from the US Department of Commerce revealed that Retail Sales in December expanded above estimates in month-over-month numbers, at 0.6%. At the same time, in 12 months to December data, sales grew at a 5.6% rate, crushing November’s 4%. Lately, the US Federal Reserve (Fed) revealed that Industrial Production for the same period edged up by 0.1%, a substantial recovery after plunging 0.0.8% in October and printing a 0% reading in the next month.
After the data, the Greenback remained in the driver’s seat, a headwind for the GBP/USD pair. The US Dollar gained momentum following remarks from Fed Governor Waller, who stressed there’s “no reason to move as quickly or cut as rapidly as in the past,” keeping investors in check despite supporting rate cuts if inflation continued to trend sustainably towards its 2% goal.
Across the pond, the ONS in the UK revealed that inflation jumped the most in December, for the first time in 10 months, and increased the pressure on the Bank of England (BoE). Consequently, the Pound Sterling rose against the US Dollar and the Euro (EUR). Figures showed that yearly inflation rose 4%, above the consensus of 3..8%, while underlying inflation surpassed the 5% threshold.
Sources cited by Reuters said “The stronger than expected reading for both core and services inflation in December .. are disappointing and will discourage the BoE from beginning to cut rates sooner.” Market participants expect the BoE to cut rates 80% in May, while odds for a Fed rate cut are seen at 60% in March¸ lower than yesterday’s 76.3%.
GBP/USD Price Analysis: Technical outlook
The GBP/USD daily chart portrays the pair as neutral to downward biased, even thought price action on Wednesday, could complete a ‘bullish piercing’ pattern, which would suggest further upside is seen. Nevertheless, given that the most important UK data is on the rearview mirror, that could pave the way to challenge the 50-day moving average at 1.2599, below the 1.2600 as sellers could test the 200-day moving average (DMA) at 1.2545. On the other hand, if buyers lift the pair above 1.2700, that could shift the bias to neutral, and open the door for a 1.2800 test.
(Click on image to enlarge)

More By This Author:
GBP/JPY Surpasses 187.00 Psychological Level After Solid UK Inflation Data
EUR/GBP Struggles To Gain Ground Above 0.8600 Following UK CPI Data
USD/CAD Rises To Near 1.3500 On Market Caution, Lower Crude Oil Prices
Disclosure: Information on this article contains forward-looking statements that involve risks and uncertainties. Markets and instruments profiled on this page are for informational purposes ...
more


