
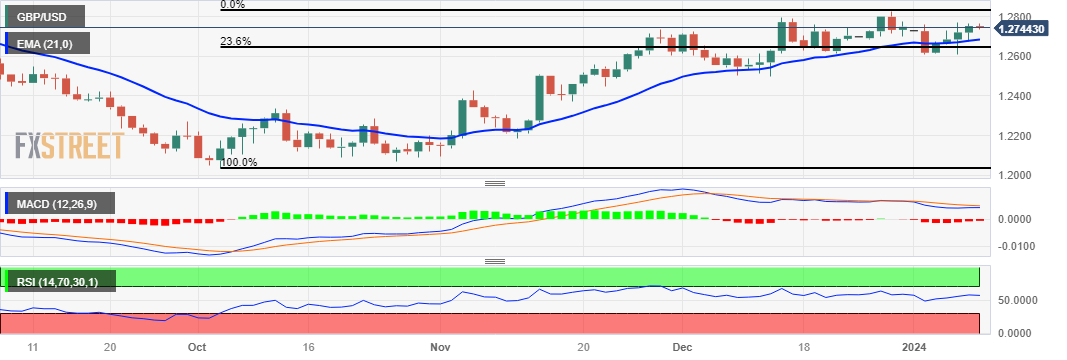
GBP/USD halts a four-day winning streak, trading lower near 1.2750 during the early European session on Tuesday. The GBP/USD pair is at a critical juncture, and the possibility of a break below the major level raises the potential for further downward pressure. The 21-day Exponential Moving Average (EMA) at 1.2684 serves as an immediate support level to monitor.
A breach below the 21-day EMA could signal increased selling pressure, and the pair might then approach the major support at 1.2650. This level, aligned with the 23.6% Fibonacci retracement at 1.2643, adds technical significance to the support zone.
The 14-day Relative Strength Index (RSI) being positioned above the 50 level is a positive sign, indicating bullish momentum for the GBP/USD pair. An RSI above 50 generally suggests that buying pressure is prevailing, and it aligns with the notion of an upward outlook for the pair.
In addition, the Moving Average Convergence Divergence (MACD) indicator also provides interesting insights. The fact that the MACD line is above the centerline is a bullish signal, suggesting potential upward momentum. However, the convergence below the signal line may indicate a degree of caution among investors.
On the upside, the GBP/USD pair could reach the previous week’s high at 1.2771. A breach above the latter could support the GBP/USD pair to explore the region around the psychological level at 1.2800 followed by December’s high at 1.2827.
GBP/USD: Daily Chart
GBP/USD: ADDITIONAL TECHNICAL LEVELS
| OVERVIEW | |
|---|---|
| Today last price | 1.275 |
| Today Daily Change | -0.0002 |
| Today Daily Change % | -0.02 |
| Today daily open | 1.2752 |
| TRENDS | |
|---|---|
| Daily SMA20 | 1.2695 |
| Daily SMA50 | 1.2555 |
| Daily SMA100 | 1.2448 |
| Daily SMA200 | 1.254 |
| LEVELS | |
|---|---|
| Previous Daily High | 1.2767 |
| Previous Daily Low | 1.2674 |
| Previous Weekly High | 1.2771 |
| Previous Weekly Low | 1.2611 |
| Previous Monthly High | 1.2828 |
| Previous Monthly Low | 1.2501 |
| Daily Fibonacci 38.2% | 1.2731 |
| Daily Fibonacci 61.8% | 1.2709 |
| Daily Pivot Point S1 | 1.2695 |
| Daily Pivot Point S2 | 1.2637 |
| Daily Pivot Point S3 | 1.2601 |
| Daily Pivot Point R1 | 1.2788 |
| Daily Pivot Point R2 | 1.2825 |
| Daily Pivot Point R3 | 1.2882 |
More By This Author:
EUR/USD Price Analysis: Edges Lower To Near Major Support At 1.0950EUR/JPY Price Analysis: Extends Losses To Two Days, Diving Below 158.00
USD/JPY Price Analysis: Dips Amid Falling US Dollar At The Brisk Of Cracking Below 144.00


Comments
Log in or sign up to join the conversation.