EUR/USD Price Analysis: Edges Lower To Near Major Support At 1.0950

Image Source: Pixabay
- EUR/USD retraces its recent gains as the US Dollar trims its intraday losses.
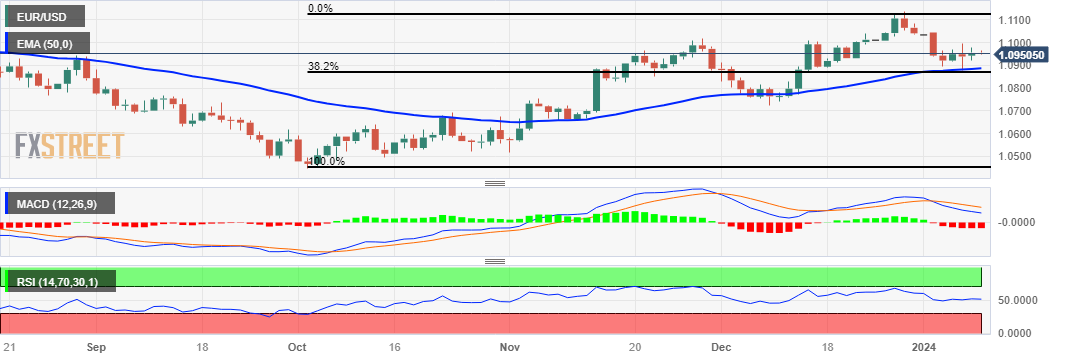
- A break below 1.0900 could push the pair to navigate the 50-day EMA at 1.0887 followed by the 38.2% Fibonacci retracement level at 1.0867.
- The psychological level at 1.1000 appears as the key resistance followed by the previous week’s high at 1.1038 level.
EUR/USD retraces its recent gains as the US Dollar (USD) attempts to recover its recent losses. The EUR/USD pair trades lower near 1.0950 major support during the Asian session on Tuesday. A break below could lead the pair to test the psychological level at 1.0900 as the key support region.
A firm collapse below the latter could put downward pressure on the EUR/USD pair to approach the 50-day Exponential Moving Average (EMA) at 1.0887 followed by the 38.2% Fibonacci retracement level at 1.0867 and a major support at 1.0850.
The 14-day Relative Strength Index (RSI) still lies above the 50 mark, indicating an upward momentum in the EUR/USD pair. However, the lagging indicator Moving Average Convergence Divergence (MACD) line is situated above the centerline but diverging below the signal line, suggesting a potential shift toward a downward trend for the EUR/USD pair. Traders will likely wait for the confirmation before making their bets in the pair.
On the upside, the EUR/USD pair could find the key resistance at the 1.1000 psychological level. A breakthrough above the psychological level could help the EUR/USD pair to reach the previous week’s high at 1.1038 level.
EUR/USD: Daily Chart
EUR/USD: MORE TECHNICAL LEVELS TO WATCH
| OVERVIEW | |
|---|---|
| Today last price | 1.095 |
| Today Daily Change | -0.0005 |
| Today Daily Change % | -0.05 |
| Today daily open | 1.0955 |
| TRENDS | |
|---|---|
| Daily SMA20 | 1.0971 |
| Daily SMA50 | 1.0871 |
| Daily SMA100 | 1.0763 |
| Daily SMA200 | 1.0847 |
| LEVELS | |
|---|---|
| Previous Daily High | 1.0979 |
| Previous Daily Low | 1.0923 |
| Previous Weekly High | 1.1046 |
| Previous Weekly Low | 1.0877 |
| Previous Monthly High | 1.114 |
| Previous Monthly Low | 1.0724 |
| Daily Fibonacci 38.2% | 1.0957 |
| Daily Fibonacci 61.8% | 1.0944 |
| Daily Pivot Point S1 | 1.0925 |
| Daily Pivot Point S2 | 1.0896 |
| Daily Pivot Point S3 | 1.0869 |
| Daily Pivot Point R1 | 1.0981 |
| Daily Pivot Point R2 | 1.1008 |
| Daily Pivot Point R3 | 1.1038 |
More By This Author:
EUR/JPY Price Analysis: Extends Losses To Two Days, Diving Below 158.00USD/JPY Price Analysis: Dips Amid Falling US Dollar At The Brisk Of Cracking Below 144.00
XAG/USD Trims Losses Amid Weak Dollar And Lower Yields, Positive Market Mood
Disclosure: Information on this article contains forward-looking statements that involve risks and uncertainties. Markets and instruments profiled on this page are for informational purposes ...
more


