GBP/USD Outlook: Dollar’s Longest Weekly Rally In A Decade
The GBP/USD maintains a bearish outlook. On Friday, the dollar was on track for its lengthiest weekly winning streak in nearly a decade. A consistent stream of robust US economic data drove this strength. Still, the dollar saw a marginal 0.15% decline, allowing the pound to recover slightly.
Notably, the pound remained at a three-month low against the strengthening dollar on Thursday. Traders were attentive to the Bank of England’s dovish signals and a reduction in corporate inflation expectations.
Meanwhile, the dollar strengthened Thursday, driven by US jobless claims hitting their lowest since February. Consequently, the figures heightened expectations of prolonged higher US interest rates, resulting in a softening of the pound against the dollar.
Elsewhere, Bank of England Governor Andrew Bailey indicated that the central bank is getting closer to concluding its series of interest rate hikes. However, he mentioned that borrowing costs might still need to rise further due to persistent inflation pressures.
Rate hike bets fell further on Thursday. A Bank of England (BoE) survey revealed that UK businesses plan to implement their smallest price increases since February 2022. Moreover, they anticipate raising prices over the next year by a smaller margin than previously planned. This survey reassures policymakers that inflation will return to its target.
Traders estimate a 75% probability of a 25 basis points hike at the central bank’s next policy meeting on September 21.
GBP/USD key events today
The pair might end the week quietly as investors are not expecting key economic releases from Britain or the US.
GBP/USD technical outlook: Breakdown of 1.2451 looms
(Click on image to enlarge)

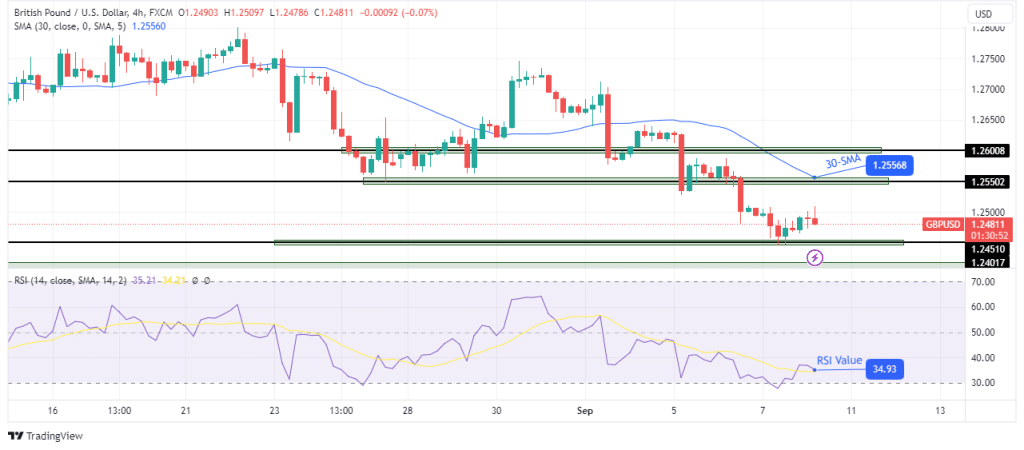
GBP/USD 4-hour chart
On the charts, GBP/USD is bearish. The price has made a series of lower lows and highs and has consistently broken below support levels. Moreover, it is easy to see that bears make larger and stronger candles than bulls.
This strength can also be seen in the indicators. The 30-SMA is above the price, acting as resistance, while the RSI trades near the oversold region. Currently, bears have paused at the 1.2451 support level. However, they look ready to retest and possibly break below this level.
More By This Author:
Gold Price Struggling To Rebound After Upbeat Jobs DataUSD/JPY Outlook: Hits 8-Month Top Amid Firm Greenback
USD/CAD Forecast: CAD Struggles as BoC Unchanged at 5%
Disclaimer: Foreign exchange (Forex) trading carries a high level of risk and may not be suitable for all investors. The risk grows as the leverage is higher. Investment objectives, risk ...
more


