
The GBP/USD sank just south of the 1.2200 handle heading into the Friday market close, and the pair finds itself still struggling under the weight of a heavy bearish trend.
Inflation continues to be a hot topic for the Bank of England (BoE), and the UK may have no choice but to continue facing down high interest rates. With prices continuing to grow above the BoE's target, interest rate cuts remain a far-off dream for market investors hoping to get their borrowing and funding costs eased.
UK labor conditions continue to deteriorate, and the manufacturing outlook remains pessimistic looking forward.
Next week the UK will see Manufacturing Purchasing Manager Index (PMI) figures for September; the PMI data is broadly expected to show continued deterioration in economic expectations.
The US Dollar (USD) is set to remain well-bid through next week's trading window. An impending US government shutdown is seeing the Greenback bolstered across the broader market, and a government shutdown could see next week's Non-Farm Payrolls delayed.
GBP/USD technical outlook
The Sterling got rejected from the 200-hour Simple Moving Average after peaking at an intraday high of 1.2270 on Friday, sending the pair into a fresh low of 1.2180 for the day.
The GBP/USD is currently pinned to the midpoint at the 34-hour Exponential Moving Average (EMA) as intraday momentum bleeds out, and the midweek's bounce from a near-term low if 1.2110 looks set to run out of steam.
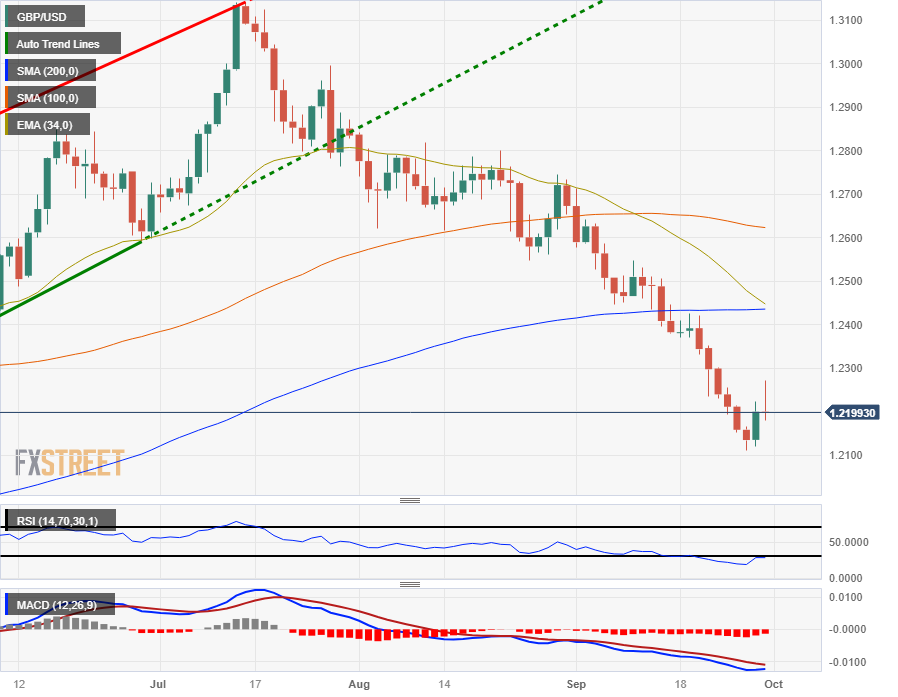
Daily candlesticks have the GBP/USD deeply off the beaten path, tumbling away from the 200-day SMA currently parked just above 1.2400, and the pair is set to continue charging into fresh six-month lows is selling pressure keeps up.
A descending 34-day EMA is providing dynamic resistance for any potential bullish pullbacks, and is currently priced in at the 200-day SMA, looking for a bearish crossover.
GBP/USD daily chart
(Click on image to enlarge)
GBP/USD technical levels
GBP/USD
| OVERVIEW | |
|---|---|
| Today last price | 1.2199 |
| Today Daily Change | -0.0001 |
| Today Daily Change % | -0.01 |
| Today daily open | 1.22 |
| TRENDS | |
|---|---|
| Daily SMA20 | 1.2394 |
| Daily SMA50 | 1.2602 |
| Daily SMA100 | 1.2626 |
| Daily SMA200 | 1.2435 |
| LEVELS | |
|---|---|
| Previous Daily High | 1.2225 |
| Previous Daily Low | 1.212 |
| Previous Weekly High | 1.2425 |
| Previous Weekly Low | 1.2231 |
| Previous Monthly High | 1.2841 |
| Previous Monthly Low | 1.2548 |
| Daily Fibonacci 38.2% | 1.2185 |
| Daily Fibonacci 61.8% | 1.216 |
| Daily Pivot Point S1 | 1.2139 |
| Daily Pivot Point S2 | 1.2077 |
| Daily Pivot Point S3 | 1.2034 |
| Daily Pivot Point R1 | 1.2243 |
| Daily Pivot Point R2 | 1.2286 |
| Daily Pivot Point R3 | 1.2348 |
More By This Author:
Gold Bounces Back On US Dollar Correction Ahead Of Fed’s Preferred Inflation GaugeEUR/JPY Approaches 160.00 Despite Soft Eurozone HICP Data
USD/CAD Price Analysis: Loses Momentum Below 1.3460 Ahead Of US PCE Data


Comments
Log in or sign up to join the conversation.