GBP/USD Forex Signal: Sterling Uptrend Has Room To Run
The GBP/USD pair has risen in the past five straight days and is now hovering near its highest point since August.
Bullish view
- Buy the GBP/USD pair and set a take-profit at 1.300.
- Add a stop-loss at 1.2600.
- Timeline: 1-3 days.
Bearish view
- Set a sell-stop at 1.2720 and a take-profit at 1.2650.
- Add a stop-loss at 1.2820.
The British pound had a strong performance in November as the US dollar continued its downtrend. The GBP/USD pair surged to a high of 1.2740, its highest point since August 30th. It has risen sharply from its October low of 1.2040.
US dollar sell-off continues
The main theme in the forex market in November was the weak US dollar. The dollar index, which tracks the greenback against a basket of currencies, dropped to $102.50, its lowest point since August 13th.
It slipped after the US published mixed inflation and jobs data. The labor report showed that the American economy created 150k jobs in October as the unemployment rate rose to 3.9%. In another report, the BLS said that the headline inflation dropped from 3.7% in September to 3.2% in October.
These numbers supported the view that the Federal Reserve was succeeding in engineering a soft landing. Soft landing is a situation where it brings inflation down without causing a recession.
Indeed, the second estimate of the GDP report revealed that the economy expanded by 5.2% in Q3, higher than the first estimate of 4.9%. Therefore, most economists expect that the Fed will maintain rates steady and then cut them in 2024.
The next important GBP/USD news to watch will be the upcoming US Personal Consumption Expenditure (PCE) index data. Economists expect the data to show that the PCE dropped to 3.1% in October. They also see the core PCE moving to 3.5%. The PCE report is an important one because it is the Fed’s favorite inflation gauge.
The pair also rose after more hawkish statements by Andrew Bailey, the head of the Bank of England. On Wednesday, he reiterated that inflation remained significantly above the target of 2.0%. He expects the bank will leave rates higher for a while.
GBP/USD technical analysis
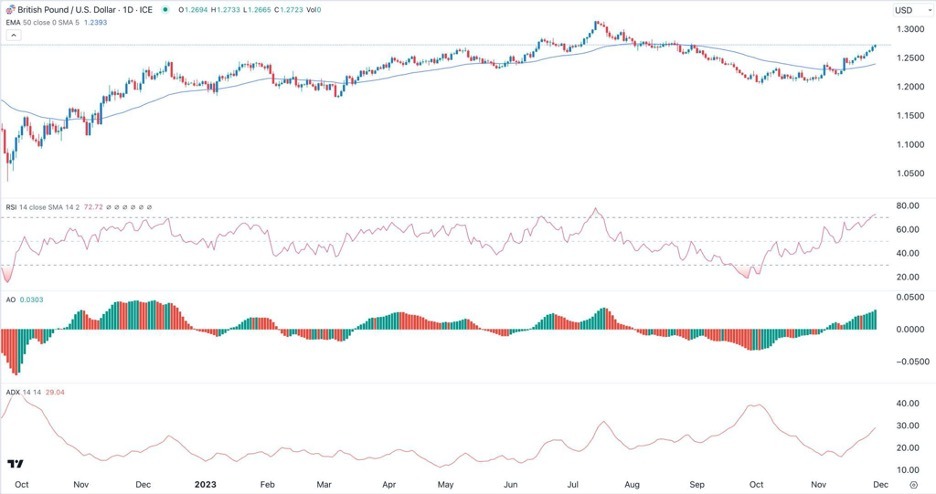
The GBP/USD pair has risen in the past five straight days and is now hovering near its highest point since August. It has crossed the 50-day moving average on the daily chart. The pair has also moved above the Ichimoku cloud indicator.
Also, the Relative Strength Index (RSI) has continued rising and has moved to the overbought level. This is a sign that the pair has a bullish momentum. The Awesome Oscillator has also continued rising.
The Average Directional Index (ADX) has risen to over 30, the highest point since October. Therefore, the pair will likely continue rising, with the next level to watch being at 1.3000.
(Click on image to enlarge)

More By This Author:
BTC/USD Forex Signal: Briefly Reaches 18-Month High PriceUSD/JPY Analysis: Amid Downward Pressure On The Dollar
AUD/USD Forex Signal: Lower Inflation Sees Aussie Pull Back
Disclosure: See the full disclosure for DailyFX here.


