GBP/USD Forex Signal: Set To Retest Key Resistance At 1.3040
Bullish view
- Buy the GBP/USD pair and set a take-profit at 1.3040.
- Add a stop-loss at 1.2825.
- Timeline: 1-2 days.
Bearish view
- Sell the GBP/USD pair and set a take-profit at 1.2825.
- Add a stop-loss at 1.3040.
(Click on image to enlarge)
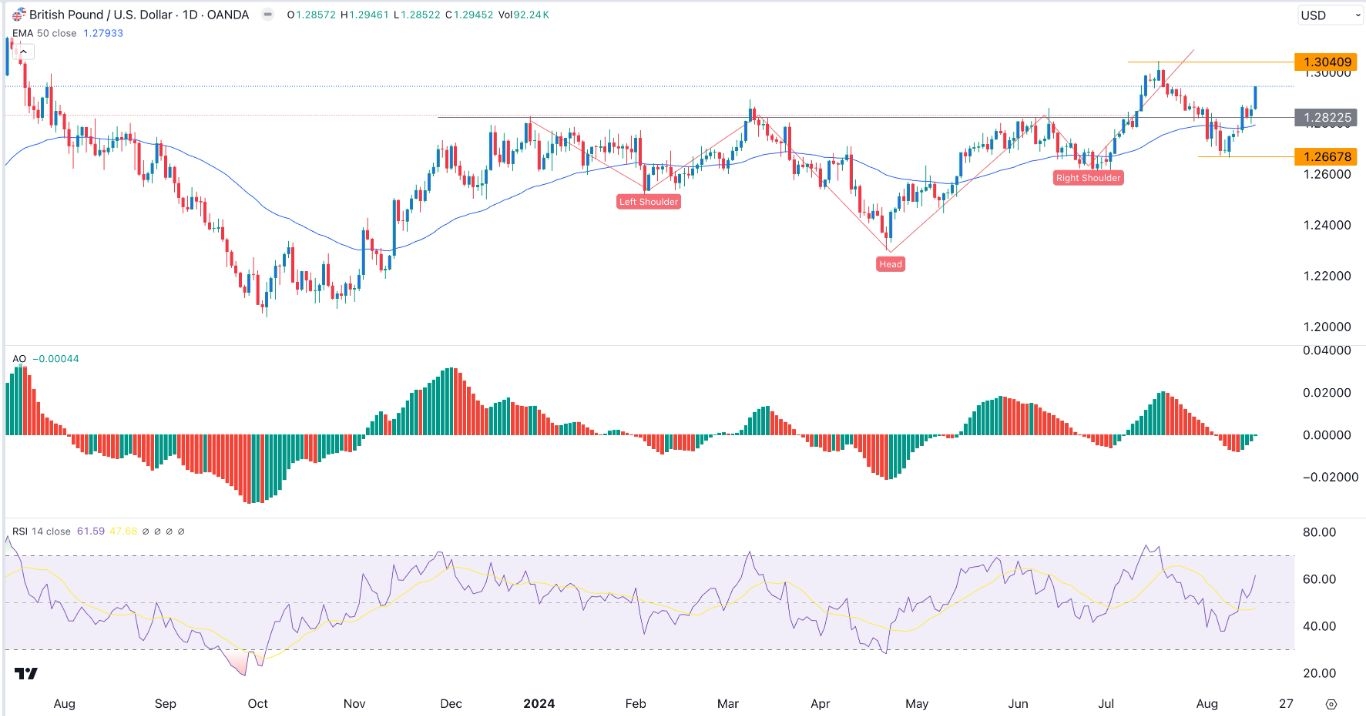
The GBP/USD pair continued rising as the US dollar index retreat accelerated. It rallied to a high of 1.2945 on Monday, its highest point since July 19. It has jumped by 2.23% from its lowest point this year and is 75bps below the year-to-date high.
UK economy is doing well
The GBP/USD rallied after the UK published encouraging data. According to the Office of National Statistics (ONS), the country’s economy rose by 0.9% in Q2, a slight improvement from the previous 0.3%.
Another report showed that the country’s retail sales rose in July albeit at a slower pace than expected. The headline retail sales rose by 0.5% in July after falling by 0.9% in the previous month. They rose by 1.4% after declining by 0.3% in June.
Core sales, which exclude the volatile items, rose by 0.7% from June and by 1.4% from the same month in 2023. These numbers mean that the UK economy was doing relatively well as the Bank of England (BoE) started cutting interest rates.
The GBP/USD pair rose as the US dollar continued falling as hopes of Federal Reserve interest rate cuts rise. The index fell to $102.30, its lowest point in weeks and much lower than the year-to-date high of over $106.
Looking ahead, the pair will react to the Federal Reserve minutes of the last meeting. In that meeting, the bank left interest rates unchanged between 5.25% and 5.50% and left the door open for a rate cut in September.
GBP/USD technical analysis
The GBP/USD has recovered after bottoming at 1.2667 on August 8. It has moved above the crucial resistance point at 1.2822, its highest level in December last year, March and June this year. This was an important level since it was the upper side of the inverse head and shoulders pattern.
The pair has remained above the 50-day moving average while the Relative Strength Index (RSI) has pointed upwards. Also, the awesome oscillator is about to move above the neutral point.
Therefore, the pair will likely continue soaring as buyers target the key resistance point at 1.3040, its highest point on July 17.
More By This Author:
BTC/USD Forex Signal: Bitcoin Weekly Chart Points To A ComebackGBP/USD Forex Signal: Bullish Ahead Of US Retail Sales Data
AUD/USD Forex Signal: Hammer Candle Hints At More Gains
Disclosure: DailyForex will not be held liable for any loss or damage resulting from reliance on the information contained within this website including market news, analysis, trading signals ...
more


