GBP/USD Forex Signal: Rising Wedge Points To More Downsides
Bearish View
- Sell the GBP/USD pair and set a take-profit at 1.2890.
- Add a stop-loss at 1.3100.
- Timeline: 1-2 days.
Bullish View
- Set a buy-stop at 1.2985 and a take-profit at 1.3100.
- Add a stop-loss at 1.2900.
(Click on image to enlarge)
The GBP/USD pair dropped to 1.2940 as the US dollar index jumped to $104.05, its highest level since August 2. It has dropped by 3.27% from its highest level in September.
US and UK Bond Yields
The GBP/USD exchange rate continued falling as the UK and US bond yields rose. Data shows that the ten-year UK Gilt rose to 4.17%, its highest level in over a week.
Similarly, in the US, the ten-year yield rose to 4.20%, its highest level since July 26. The five-year rose to 4%, the highest point since July 31st.
This trend happened as investors assessed the impact of the recent economic data from the Us and the UK. Data by the Bureau of Labor Statistics (BLS) showed that the US unemployment rate dropped to 4.1% in September.
The number of jobs created during the month rose by 254k, while wage growth continued to rise during the month.
US inflation retreated slightly to 2.4% in September, lower than the previous month’s 2.5%. Core inflation remained unchanged at 3.2%, and is moving to the 2% target rate. Retail sales remained strong, while the initial jobless claims dropped slightly a week earlier.
Therefore, analysts expect that the Fed may not continue cutting interest rates as it did in the last meeting. As such, the bank may decide to shift from 0.50% to 0.25% in the next few meetings.
The GBP/USD exchange pair retreated after Megan Greene, a Bank of England (BoE) official proposed gradual rate hikes. While inflation has moved below 2%, wage growth has remained at an elevated level, which could push prices higher.
The Bank of England has already slashed interest rates by 0.25%, and analysts see it cutting by a similar amount in November.
GBP/USD Technical Analysis
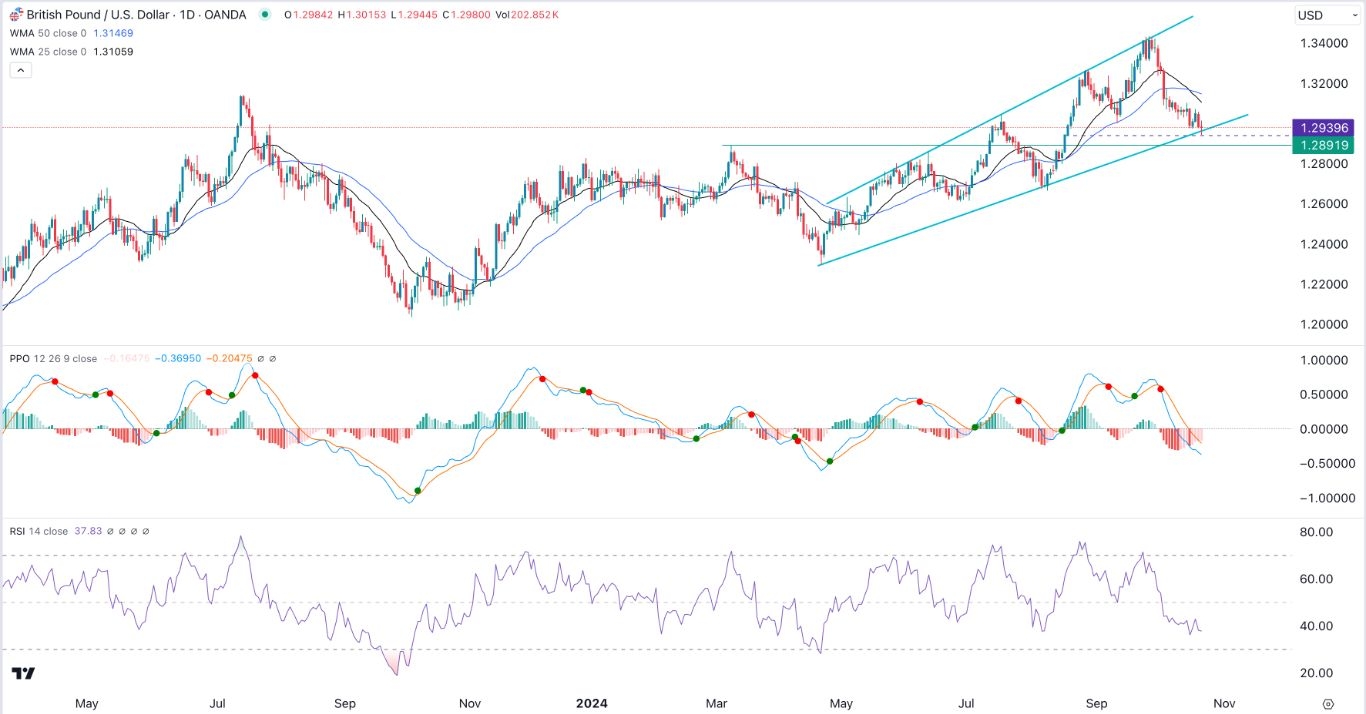
The GBP/USD pair has continued falling in the past few days. It dropped to a low of 1.2980, its lowest point since August 19. It has dropped by 3.40% below the highest point this year.
The pair has moved below the 50-day and 25-day Weighted Moving Averages (WMA), which have made a bearish crossover pattern. Also, the Producer Price Index (PPI) indicator has moved below the zero line. The Relative Strength Index (RSI) has dropped below the neutral point of 50.
It has also formed a rising broadening wedge chart pattern. Therefore, the pair will likely have a bearish breakout, with the next point to watch being at 1.2890, its highest swing on March 8.
More By This Author:
BTC/USD Forex Signal: On The Cusp Of More UpsideBTC/USD Forex Signal: Bitcoin Could Still Retest Its All-Time High
EUR/USD Forex Signal: Bearish Trend To Continue For A While
Disclosure: DailyForex will not be held liable for any loss or damage resulting from reliance on the information contained within this website including market news, analysis, trading signals ...
more


