GBP/USD Forex Signal: Rally Still Intact Despite The Pullback
Bullish view
- Buy the GBP/USD pair and set a take-profit at 1.3000.
- Add a stop-loss at 1.2800.
- Timeline: 1-2 days.
Bearish view
- Set a sell-stop at 1.2885 and a take-profit at 1.2800.
- Add a stop-loss at 1.3000.
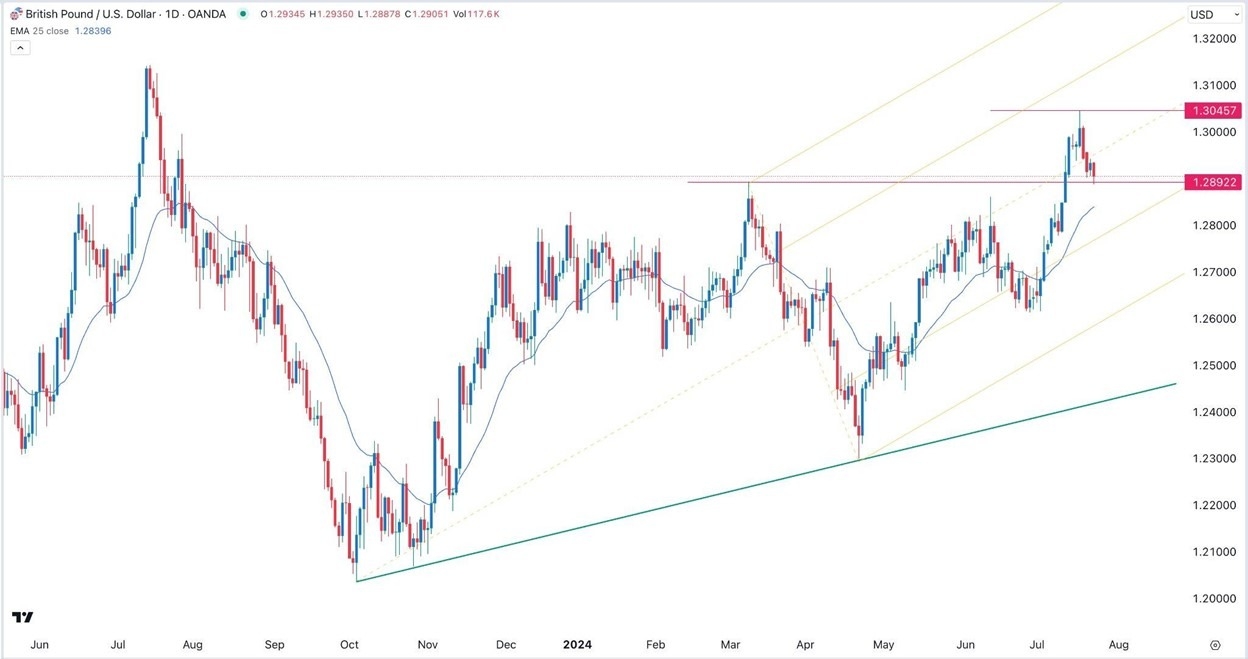
(Click on image to enlarge)
The GBP/USD pair retreated this week as traders and analysts remained divided on the next price action ahead of this week’s PCE data and next week’s Fed and BoE interest rate decisions. It dropped to 1.2900 on Wednesday, down from this month’s high of 1.3045.
Flash PMI data ahead
Analysts are divided about the next price action of the GBP/USD pair. In a note this week, analysts at JPMorgan warned that the recent rally was at risk even as bullish bets jumped to the highest level on record.
The analysts noted that sterling’s outperformance was at risk of any deterioration in the local economy. This statement came even as the Commitment of Traders (CoT) report by the Commodity Futures Trading Commission (CFTC) said that speculators had placed their biggest bullish bets on record.
Meanwhile, analysts at Amundi and Goldman Sachs took the opposite direction and predicted that the pair would rise to as high as 1.3500. Amundi noted that the currency could benefit from the stability offered by Keir Starmer, whose party won in a landslide election recently. This was a big chance of tune by Amundi, which placed a short trade on the sterling last year.
The GBP/USD pair will react to the flash manufacturing and services PMI data from the US and the UK. Economists expect the data to show that the UK’s manufacturing PMI rose from 50.9 in June to 51.1 in July while the services figure rose to 52.6. Such positive numbers will be good for the pound.
The US data is expected to show that the two PMIs improved to 51.6 and 54.7, respectively. These numbers will come ahead of the US GDP data on Thursday and the PCE inflation figures on Friday.
GBP/USD technical analysis
The GBP/USD pair has retreated this week after forming a shooting star pattern whose upper side was at 1.3045, its highest level since July last year. It has dropped and retested the key support level at 1.2892, its highest swing on March 8th. This could be a sign of break and retest chart pattern, a sign of a bullish continuation.
The pair remains above the 25-day moving average and slightly below the middle line of the Andrews pitchfork tool. Therefore, the GBP/USD exchange rate will likely bounce back as traders target the psychological point at 1.300.
More By This Author:
BTC/USD Forex Signal: Bitcoin Is Extremely Bullish Above 68,453BTC/USD Forex Signal: Falling Broadening Wedge Points To More Upside
EUR/USD Forex Signal: Cup And Handle Points To A Rebound
Disclosure: DailyForex will not be held liable for any loss or damage resulting from reliance on the information contained within this website including market news, analysis, trading signals ...
more


