GBP/USD Forex Signal: Plunging To 6-Month Lows
Everything looks bearish, but it is always a bit risky to enter a new short trade in this situation without seeing first a consolidation or retracement to a key resistance level.
My previous GBP/USD signal on 20th September produced an excellent short trade from the bearish inside bar rejection on the hourly chart of the resistance level which I had identified at $1.2416.
Today’s GBP/USD Signals
Risk 0.75%.
Trades must be entered between 8am and 5pm London time today only.
Long Trade Ideas
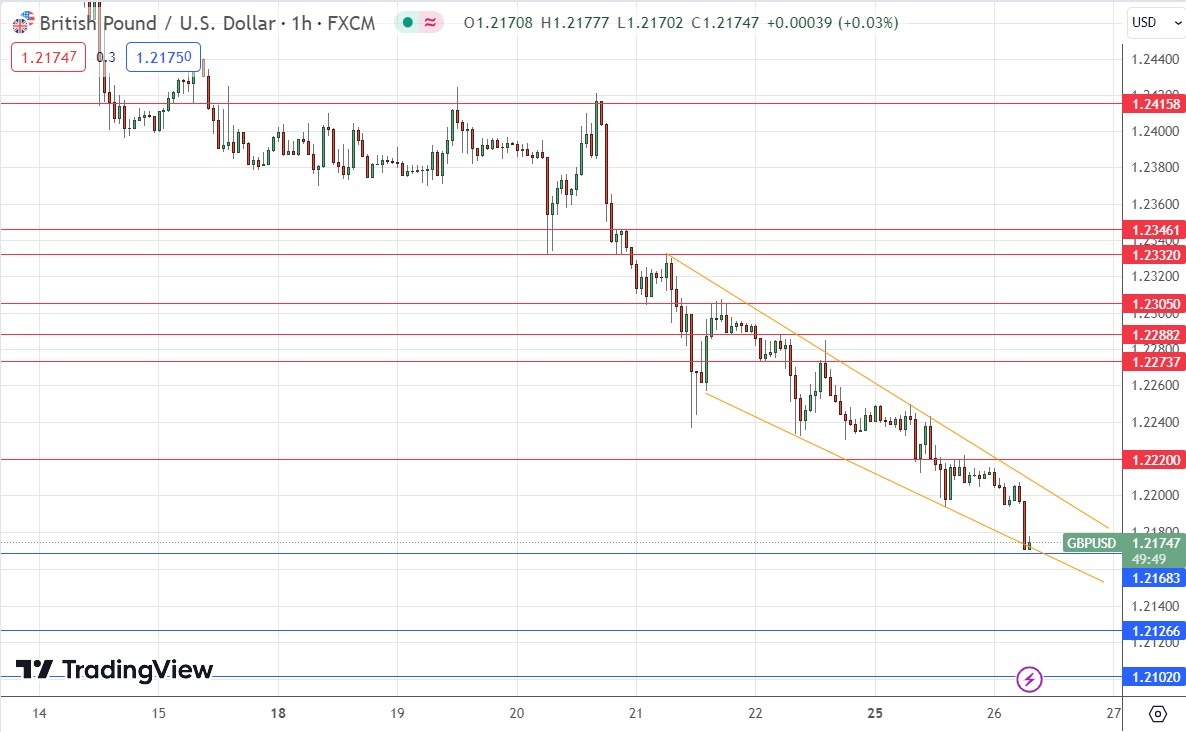
- Long entry following a bullish price action reversal on the H1 timeframe immediately upon the next touch of $1.2168, $1.2127, or $1.2102.
- Place the stop loss 1 pip below the local swing low.
- Move the stop loss to break even once the trade is 25 pips in profit.
- Remove 50% of the position as profit when the price reaches 25 pips in profit and leave the remainder of the position to ride.
Short Trade Ideas
- Short entry following a bearish price action reversal on the H1 timeframe immediately upon the next touch of $1.2220 or $1.2274.
- Place the stop loss 1 pip above the local swing high.
- Move the stop loss to break even once the trade is 25 pips in profit.
- Remove 50% of the position as profit when the price reaches 25 pips in profit and leave the remainder of the position to ride.
The best method to identify a classic “price action reversal” is for an hourly candle to close, such as a pin bar, a doji, an outside or even just an engulfing candle with a higher close. You can exploit these levels or zones by watching the price action that occurs at the given levels.
GBP/USD Analysis
I wrote in my previous forecast for the GBP/USD currency pair that the lower-than-expected UK CPI (inflation) data print earlier that day would likely push the Pound lower. I therefore thought that if we had gotten two consecutive lower hourly closes below $1.2370 during the first half of the London session, I was ready to enter a new short trade targeting the nearest support level at $1.2306.
This was a good call, at least for correctly identifying the $1.2370 level as a pivotal point, as the price rejected it and rose during the first half of the London session. However, the good news for bears that day was that the price rose to reach the nearest resistance level that day, then rejected it, giving a very nice short trade entry opportunity from the bearish hourly inside bar which rejected the resistance at $1.2416.
The price has been falling firmly and quite strongly over the past few days, making a new 6-month low this morning as the London session gets underway. The price chart below shows a fairly steep bearish wedge chart pattern.
We have a bearish “perfect storm” here, with the US Dollar strong as a safe haven on declining risk sentiment, and all the European currencies weak, with the British Pound more or less the weakest of all. The price chart shows the price simply continues to fall without making any strong retracements over recent hours.
Everything looks bearish, but it is always a bit risky to enter a new short trade in this situation without seeing first a consolidation or retracement to a key resistance level. As the price is quite extended now, I do not see an obvious technical breakdown point at which to look for an entry either.
However, I am short of this currency pair, and I remain bearish. I would be happy to enter another short trade following a retracement to a resistance level, or if we get a consolidation above a support level lasting several hours eventually producing a breakdown.
(Click on image to enlarge)

More By This Author:
BTC/USD Forex Signal: BTC Outshines Stocks, Bonds as Risks RiseGBP/USD Forex Signal: No End In Sight For The Sterling Freefall
BTC/USD Forex Signal: Crypto Fear And Greed Index Slips
Disclosure: DailyForex will not be held liable for any loss or damage resulting from reliance on the information contained within this website including market news, analysis, trading signals ...
more


