GBP/USD Forex Signal: Death Cross Pattern Forms
Bearish view
- Sell the GBP/USD pair and set a take-profit at 1.2000.
- Add a stop-loss at 1.2300.
- Timeline: 1-2 days.
Bullish view
- Set a buy-stop at 1.2200 and a take-profit at 1.2300.
- Add a stop-loss at 1.2100.
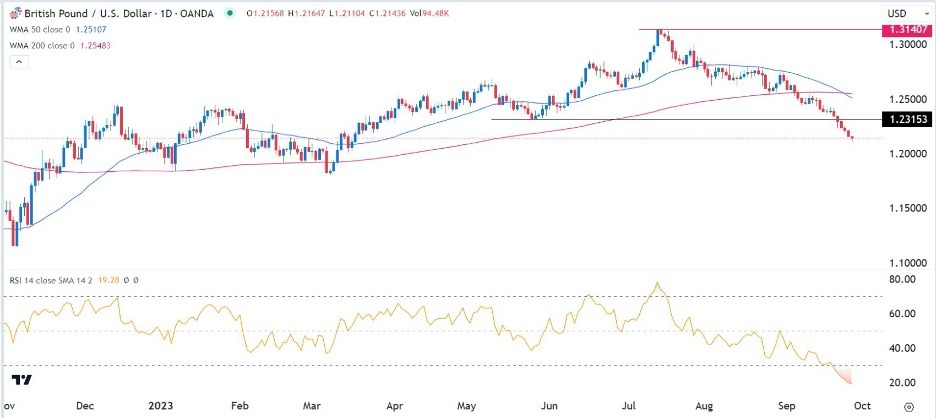
The GBP/USD pair has retreated in the past six straight days and moved to the lowest point since March 17th. Sterling plunged to a low of 1.2116, ~7.60% from the highest level in July as the US dollar index surged.
US GDP data ahead
The US dollar index continued its bullish trend on Thursday as many investors moved to its safety. The most recent data shows that the index jumped to $106.76, the highest level since November 2022. It has jumped by over 7% from the lowest level this year.
The dollar strength has rallied as investors react to the hawkish Federal Reserve. In its decision last week, the Federal Reserve decided to leave rates unchanged between 5.25% and 5.50%. The accompanying dot plot showed that officials expect another 0.25% hike later this year.
The Bank of England (BoE), on the other hand, left rates unchanged after a report by the Office of National Statistics (ONS) showed that inflation was easing. Most analysts believe that the BoE will not hike again since the UK economy is not doing well.
The GBP/USD pair retreated after the US published strong durable goods order numbers on Wednesday. The data showed that durable goods orders rose to 0.2% in August after falling by 5.6% in the previous month. Core durable goods orders rose by 0.4%, better than the median estimate of 0.1%.
Looking ahead, the important data to watch on Thursday will be the final reading of US Q2 GDP data. Based on the last estimate, economists expect the data to show that the economy expanded by 2.2% in Q2 after gaining by 2.0% in the previous quarter. The US will also release the latest initial and continuing jobless rate data.
GBP/USD technical analysis
The GBP/USD has nosedived in the past few months. It flipped the important support at 1.2315 on September 21st. This was a notable level since it was the lowest point in May. The Relative Strength Index (RSI) has crashed to the oversold level.
Most importantly, the 50-day and 200-day Weighted Moving Average (WMA) have formed a bearish crossover, commonly known as a death cross. Therefore, the pair will likely continue falling as sellers target the key support at 1.2000.
(Click on image to enlarge)

More By This Author:
GBP/USD Technical Analysis: When Can You Buy?BTC/USD Forex Signal: Bitcoin Steady As Fear And Greed Index Slips
GBP/USD Forex Signal: Plunging to 6-Month Lows
Disclosure: DailyForex will not be held liable for any loss or damage resulting from reliance on the information contained within this website including market news, analysis, trading signals ...
more


