GBP/USD Forex Signal: Bulls Need To Overcome Resistance At 1.3140
Bullish view
- Buy the GBP/USD pair and set a take-profit at 1.3145.
- Add a stop-loss at 1.3000.
- Timeline: 1-2 days.
Bearish view
- Set a sell-stop at 1.3080 and a take-profit at 1.1.2950.
- Add a stop-loss at 1.3145.
(Click on image to enlarge)
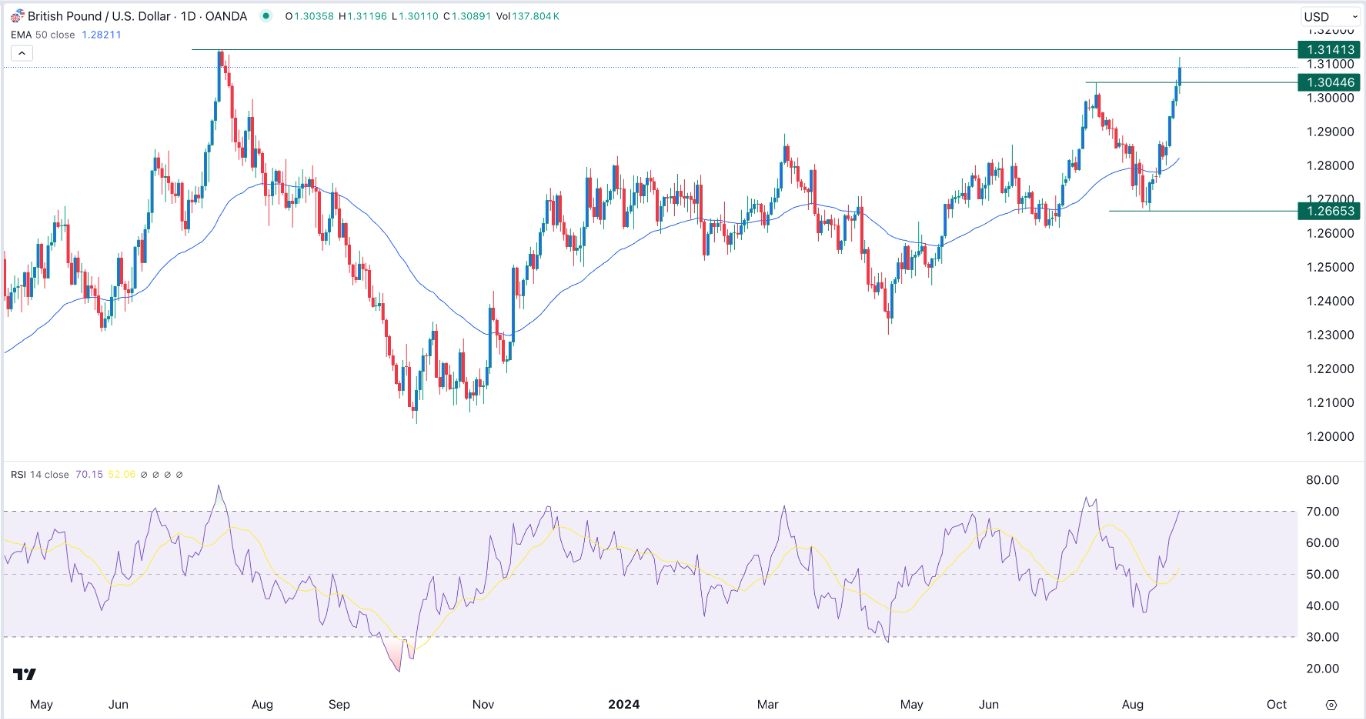
The GBP/USD pair relentless rally gained steam after the Federal Reserve minutes reinforced the view that the bank will cut interest rates in the next meeting. It soared to a high of 1.3120, its highest level in over a year.
Minutes released on Wednesday showed that officials grew increasingly concerned about the state of the economy, especially the labor market. As a result, most of these officials supported cutting rates if the US released more weak data.
The country has published several weak economic data since that meeting. For example, a report by the BLS revealed that the unemployment rate rose to 4.3% in July. Chances are that the number is much worse since a revision of the job report showed that the nonfarm payrolls were revised by the biggest margin in over a decade.
Therefore, Jerome Powell is expected to confirm that the Fed will start cutting interest rates when he speaks at the Jackson Hole Symposium on Friday.
The Bank of England (BoE) has already started slashing interest rates. It lowered the official cash rate by 0.25% in the last meeting and analysts are anticipating more cuts later this year.
S&P Global will release the US and UK flash manufacturing and services PMI data on Thursday. These are important numbers the state of the economy in August. However, these numbers will not change the Fed’s and the BoE’s view on the economy.
GBP/USD technical analysis
The GBP/USD recent surge has pushed it to the highest level since July 2023. Notably, the pair managed to cross the important resistance level at 1.3045, its highest swing on July 17th.
By moving above that technical level, the pair invalidated the double-top pattern whose neckline was at 1.2665, its lowest point this month. The pair now faces another important resistance point at 1.3141, its highest level in July 2023. A break above that level will be a validation for the bulls again.
While the pair has risen sharply recently, the Relative Strength Index (RSI) indicator points to more gains since it is not yet in the overbought level. The RSI is a popular indicator that looks at the rate of change of an asset.
Therefore, there are two potential scenarios. First, the pair may continue rising and move above the resistance at 1.3141. Second, the other situation is where investors sell the news since Jerome Powell’s dovish tone has been priced in. If this happens, it will likely retest the support at 1.3045.
More By This Author:
BTC/USD Forex Signal: Daily Chart Points To A Big BreakoutGBP/USD Forex Signal: Double Top Chart Pattern Forms
BTC/USD Forex Signal: Stuck In A Range But A Breakout Likely
Disclosure: DailyForex will not be held liable for any loss or damage resulting from reliance on the information contained within this website including market news, analysis, trading signals ...
more


