GBP/USD Forex Signal: Bearish Flag Pattern Points To More Sell-Off
Bearish view
- Sell the GBP/USD pair and set a take-profit at 1.2600.
- Add a stop-loss at 1.2750.
- Timeline: 1-2 days.
Bullish view
- Buy the GBP/USD pair and set a take-profit at 1.2750.
- Add a stop-loss at 1.2600.
(Click on image to enlarge)
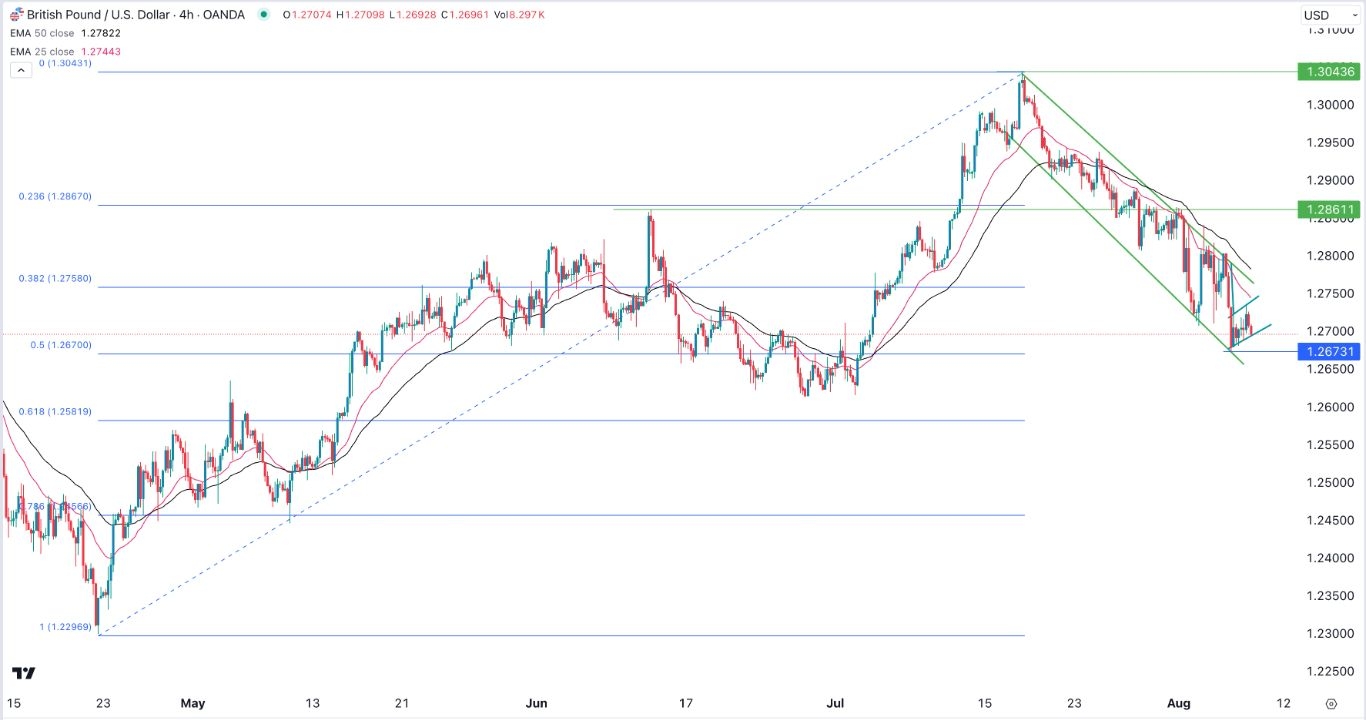
The GBP/USD exchange rate remained in a tight range as the impact of last week’s Federal Reserve and Bank of England (BoE) interest rate decisions faded. It was trading at the psychological point at 1.2700, a few points above this month’s low of 1.2673.
The pair was relatively calm since there was no major economic data from the US and the UK on Tuesday. The only data to watch will be the weekly initial and continuing jobless claims numbers, which have become important recently.
Recent data showed that the country’s jobless claims have been rising as the labor market has softened modestly. Last week, the data showed that the number of initial claims rose to 249,000 in the previous week, the highest increase since August. Economists expect Thursday’s report to show that the number of claims rose to 241,000 last week.
The number of continuing jobless claims have also been rising and hit over 1.87 million last week. These data comes at a time when more numbers have confirmed that the labor market is doing well.
Job vacancies have dropped to the lowest point since 2021 while the unemployment rate rose to 4.3% in July. The economy created just 114,000 jobs in July while wage growth stalled.
Therefore, analysts expect the Federal Reserve will start cutting interest rates soon to avert a recession or a hard landing. Those at Citi and Wells Fargo anticipate a 0.50% cut in September and 125 basis points this year. Others anticipate a 0.25% cut in September.
The Bank of England is also expected to continue cutting rates if inflation continues falling, which analysts expect will happen.
Start Trading Today With The Best Trading Platform!
GBP/USD technical analysis
The GBP/USD exchange rate has been in a steep downward trend after peaking at 1.3043. This decline is mostly because the Bank of England started cutting interest rates earlier than the Fed.
It has also moved below the 50-day moving average and formed a descending channel shown in green. The pair has also formed a bearish flag chart pattern, which is a negative side.
It has also moved below the 38.2% Fibonacci Retracement point. Therefore, the pair will likely have a bearish breakout as sellers target the key support at 1.2600, which is a few points above the 61.8% retracement point.
More By This Author:
BTC/USD Forex Signal: Death Cross Meets Falling WedgeBTC/USD Forex Signal: Rebound Could Be A Dead Cat Bounce
Walgreens Stock Yields 9.3%: Is It A Bargain Or A Value Trap?
Disclosure: DailyForex will not be held liable for any loss or damage resulting from reliance on the information contained within this website including market news, analysis, trading signals ...
more


