GBP/USD Forecast: Week Of October 2 - 6
Bearish view
- Sell the GBP/USD pair and set a take-profit at 1.2000.
- Add a stop-loss at 1.2400.
- Timeline: 1-5 days.
Bullish view
- Set a buy-stop at 1.2245 and a take-profit at 1.2400.
- Add a stop-loss at 1.2180.
The GBP/USD exchange rate's relentless sell-off gained steam last week as investors moved to the safety of the US dollar. The pair plunged to a low of 1.2121, the lowest point since March this year. It has dropped by more than 7.1% from the highest point this year.
UK doing modestly well
The US dollar index continued its surge last week as investors moved to its safety. The index jumped to a high of $106.8, the highest level since November last year. It has jumped by more than 6.7% from the lowest point this year.
The dollar has risen amid rising risks to the economy. For one, there are rising inflation risks as the price of crude oil continues soaring. Brent, the international benchmark, remains above $90 a barrel while the average gas price has jumped to $3.82.
There are other inflationary factors happening. For example, the traffic jam at the Panama Canal continued while many American workers went to a strike. On Friday, they expanded their strike to include more workers.
The impact of the strike is that used and new car prices will continue rising in the next few months. At the same time, these strikes will lead to higher wages, which will have an impact on inflation. Last month’s wage growth remained quite resilient.
The other key risk is the American government shutdown, which could go on for a while. The House of Representatives has failed to pass a stop-gap measure to keep the government funded. While the Senate passed a bipartisan bill, the House speaker has said it was dead on arrival because of Ukraine funds.
The government shutdown means that the Bureau of Labor Statistics (BLS) will not publish the latest non-farm payrolls (NFP) data on Friday and job vacancy numbers on Tuesday. The GBP/USD pair will also react to the upcoming UK Tories meeting.
GBP/USD technical analysis
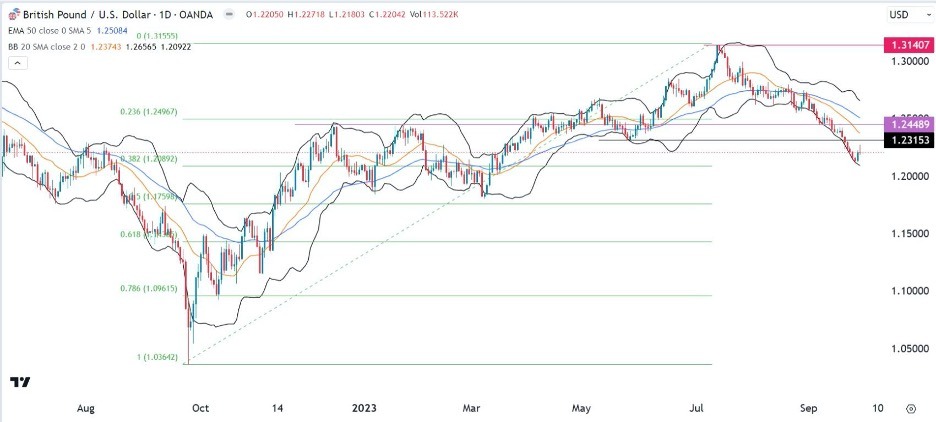
The GBP/USD pair continued its downward trend last week as the dollar strength gained steam. It has dropped from the year-to-date high of 1.3140 to 1.2100. It also moved below the important support at 1.2450, the double-top in December last year and January.
The pair retested the 38.2% Fibonacci Retracement level and moved below the 50-day moving average. It is also along the lower side of the Bollinger Bands indicator. Therefore, the pair will likely continue falling as sellers target the psychological level of 1.200.
(Click on image to enlarge)

More By This Author:
EUR/USD Weekly Signal: Bearish Sentiment As Government Shutdown Starts
Gold Technical Analysis: Gold Is Headed For 6 Month Low
BTC/USD Forex Signal: Consolidation
Disclosure: DailyForex will not be held liable for any loss or damage resulting from reliance on the information contained within this website including market news, analysis, trading signals ...
more


