

Photo by Colin Watts on Unsplash
The British Pound (GBP) is weakening against the US Dollar (USD) on Tuesday as markets look to news on trade developments, which is influencing the broader economic outlook.
For GBP/USD, fiscal concerns in the United Kingdom (UK), combined with risks of a weaker economy, have pushed prices toward 1.3550 at the time of writing.
While Federal Reserve (Fed) Chair Jerome Powell advocates for data-driven decisions and has not ruled out a July rate cut, the Fed is adopting a cautious approach amid mixed economic signals. The odds of easing in July are now minimal, and markets are increasingly targeting September as a more likely starting point.
According to the CME Fed Watch Tool, markets are pricing a 4.7% probability of a 25-basis-point move in July, down from 20.7% last week. The probability of a 25 bps rate cut in September is now 62.8%, down from 73.2% last week.
In the UK, fiscal risks are adding to the Pound’s weakness. The Office for Budget Responsibility (OBR) published its Fiscal Risks and Sustainability report on Tuesday, issuing a stark warning about the country’s long-term financial outlook.
OBR Chairman Richard Hughes warned that current UK fiscal policies are unsustainable. He foresaw that if left unchanged, government debt would increase to around 270% of GDP in the early 2070s from below 100% today.
The long-term debt path is largely a consequence of escalating costs associated with the state pension triple lock, anticipated climate-related expenditure (e.g., net-zero transitions and damage from extreme weather), and demographic pressures. Hughes noted state pension costs could rise from approximately 5% to 7% of GDP by 2070, adding further pressure on public finances.
Additionally, higher tariffs by US President Trump have given markets a scare, fuelling risk aversion and uncertainty among investors.
In response to these developments, GBP/USD is falling below the 20-day Simple Moving Average (SMA), which now provides resistance at 1.3596.
Current price action remains within the confines of an ascending channel on the daily chart, which has guided the pair since May.
Further downside pressure is emerging as the price approaches the 50-day SMA at 1.3480. A break below this level would signal a deeper bearish correction toward the 23.6% Fibonacci retracement of the January-July move at 1.3390.
The recent failure to reclaim the July 1 high of 1.3789 now confirms the presence of a short-term top.
GBP/USD daily chart
(Click on image to enlarge)
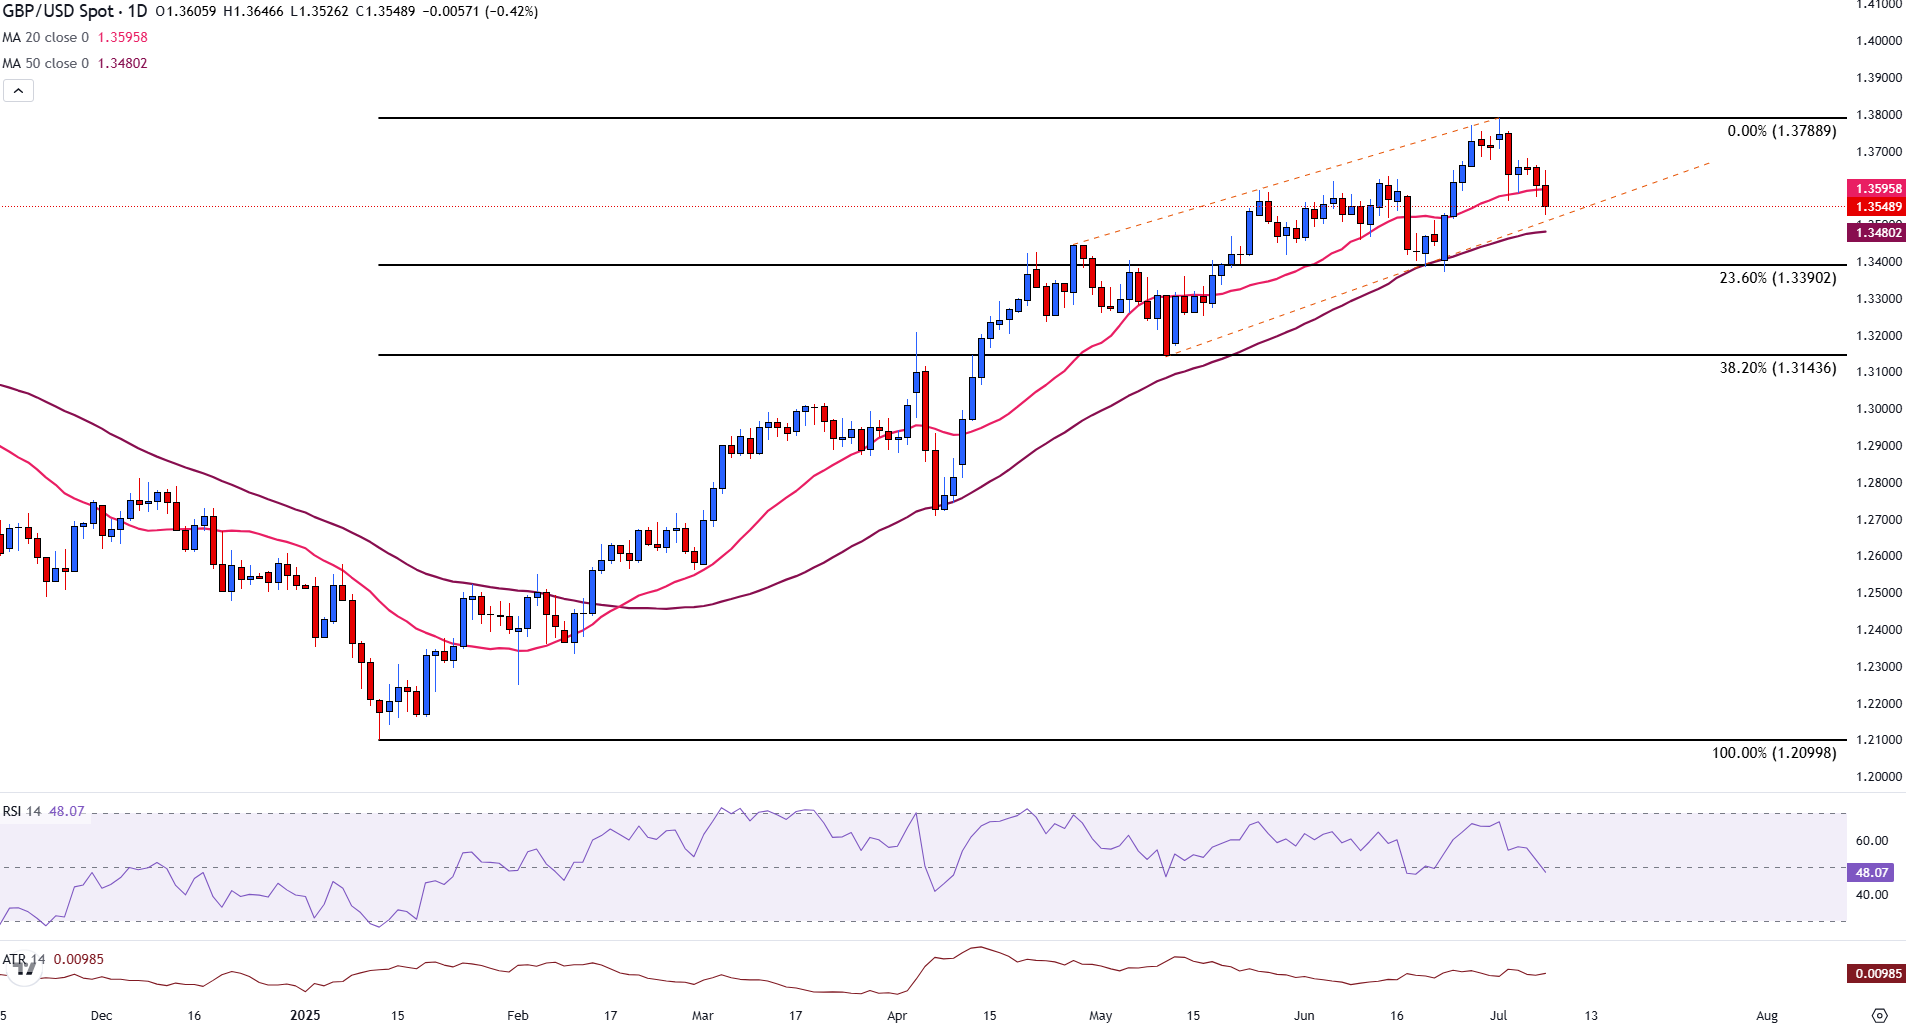
The Relative Strength Index (RSI) has dipped below 49, indicating fading bullish momentum but not yet entering oversold territory.
The Average True Range (ATR) shows a contraction in volatility, which could precede a breakout in either direction.
GBP/USD is vulnerable to further losses toward channel support, with the focus now on whether buyers can defend the 50-day SMA. A clear failure to hold above 1.3480 would confirm a deeper bearish correction, while a rebound above 1.3595 is needed to restore bullish momentum.
More By This Author:
Gold Struggles For Direction Amid New Tariff Headlines
Gold Attempts A Recovery As Trump Announces 25% Tariffs On Japan
Gold Dips As Stronger US Dollar Rises On Fed Stance And Trade Hopes


Comments
Log in or sign up to join the conversation.