
GBP/USD Declines Further As Greenback Rally Continues
Photo by Colin Watts on Unsplash
GBP/USD sank again on Thursday, falling for a sixth straight session and dragging the Pound Sterling (GBP) down nearly 3% top-to-bottom from last week’s peak near 1.3588. Cable is getting dragged back into bearish territory as the US Dollar (USD) catches a broad-market bid on renewed interest rate woes amid rebounding US inflation data and a looming Nonfarm Payrolls (NFP) report on Friday.
United States (US) economic data remains far more robust than many market watchers and policymakers had feared when the Trump administration kicked off a never-ending cycle of tariff threats and subsequent walk backs. Global reciprocal tariffs have routinely been announced, delayed, and re-announced, but key double-digit tariffs on core industries like steel and aluminum imports, as well as foreign cars, are already beginning to bite around the edges of key inflation metrics.
PCE uptick reminds Fed watchers that rate cuts are contingent on policy success
Core US Personal Consumption Expenditure Price Index (PCE) inflation ticked higher in June, rising 0.3% MoM as many market participants had expected. On an annualized basis, PCE inflation accelerated to 2.6% YoY, outrunning the expected hold at 2.5%. US Consumer Income also rebounded 0.3% in June, and rising wage pressures will add further inflationary forces further down the line.
US Nonfarm Payrolls (NFP) remain on the data docket for this Friday, promising to close out the trading week with a tense release. US jobs and inflation data have taken on additional importance for the Fed following this week’s decision to hold interest rates steady for another meeting period. Annualized headline PCE inflation, a key inflation metric for the Fed’s rate-setting policymakers, has remained above the Fed’s 2% target band for almost four and a half years.
GBP/USD price forecast
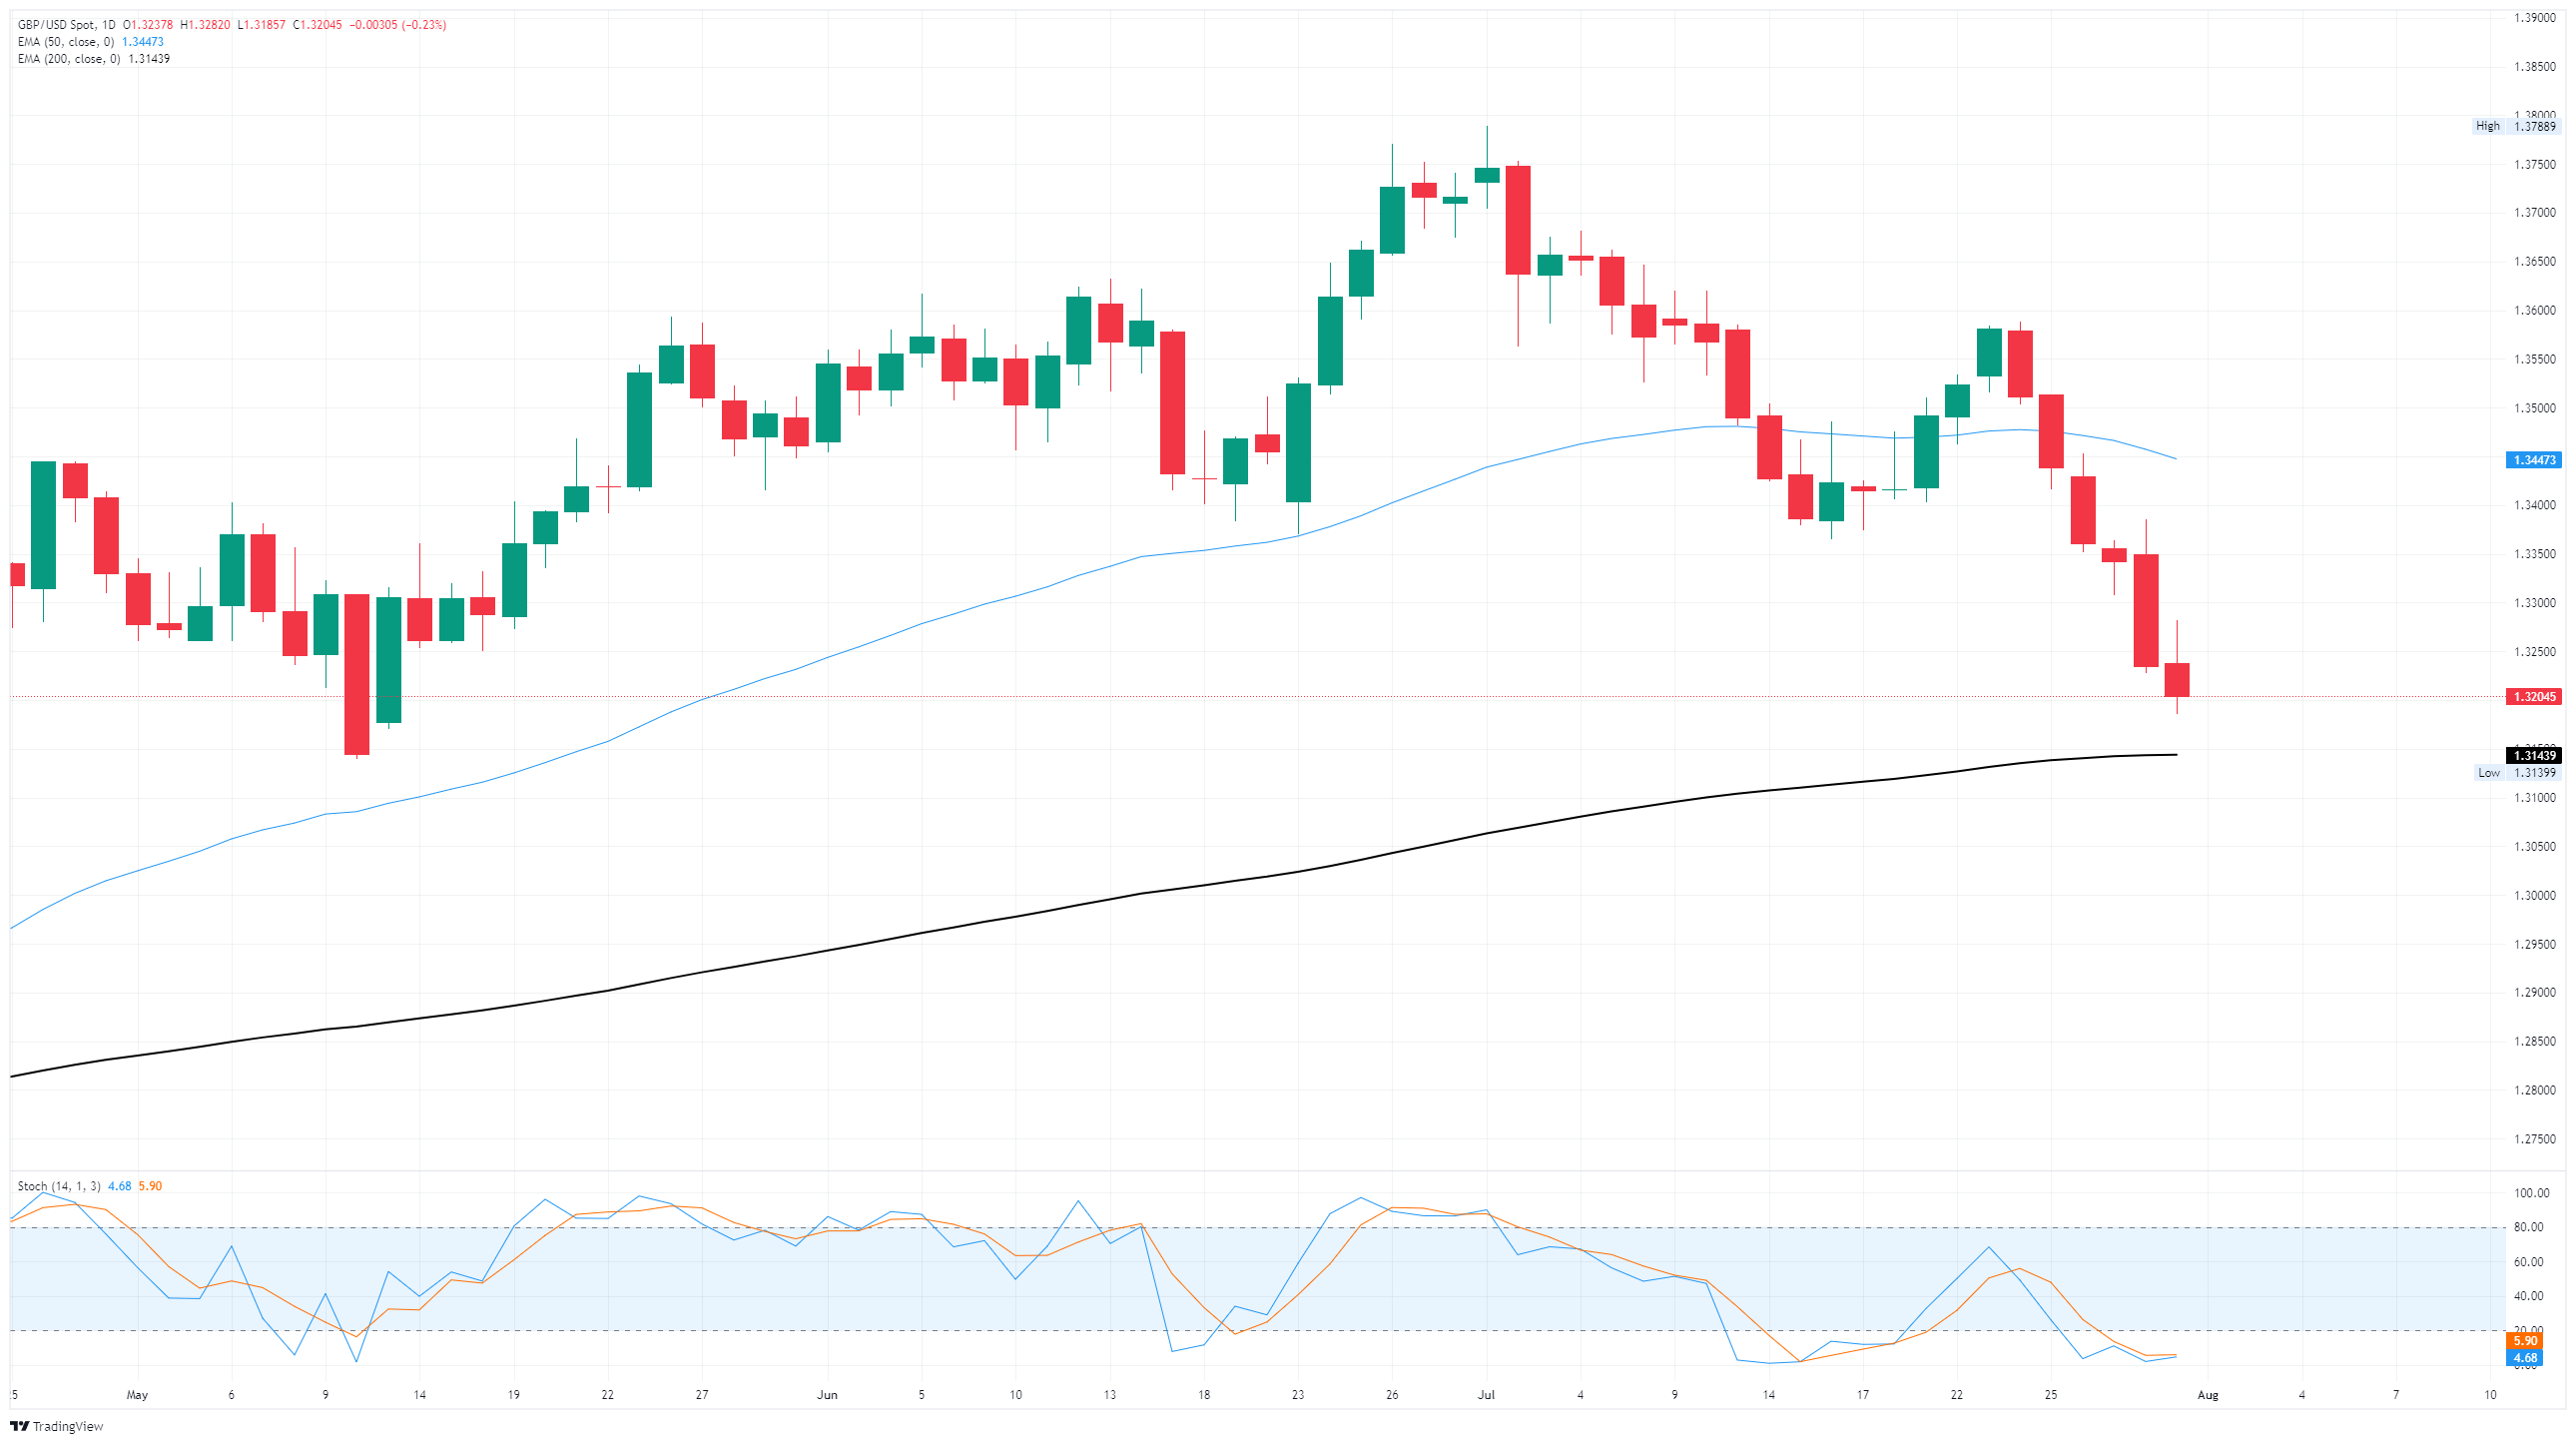
A sixth straight down day has put Cable on a collision course with the 200-day Exponential Moving Average (EMA) near 1.3131. Price action has pivoted firmly bearish after GBP/USD flubbed a bullish climb toward 1.3600, although new short entries will face challenges with technical oscillators already pinned in oversold territory.
GBP/USD daily chart
(Click on image to enlarge)
More By This Author:
Dow Jones Industrial Average Dribbles Lower After PCE Inflation Accelerates AgainGBP/USD Extends Losses After Fed Trims Rate Cut Expectations
Canadian Dollar Recedes After Fed Rate Hold


