GBP/USD Analysis: Best Buy Levels
GBP/USD faces intense selling, plunging to 1.2518. Buyers consider 1.2550 for potential rebound. Strong US job data propels USD strength, testing pound's resilience. Key support levels eyed for market direction shift.
- After the GBP/USD currency pair's strong performance last week, with gains reaching the resistance level of 1.2772, the US dollar gained strong and continuous momentum.
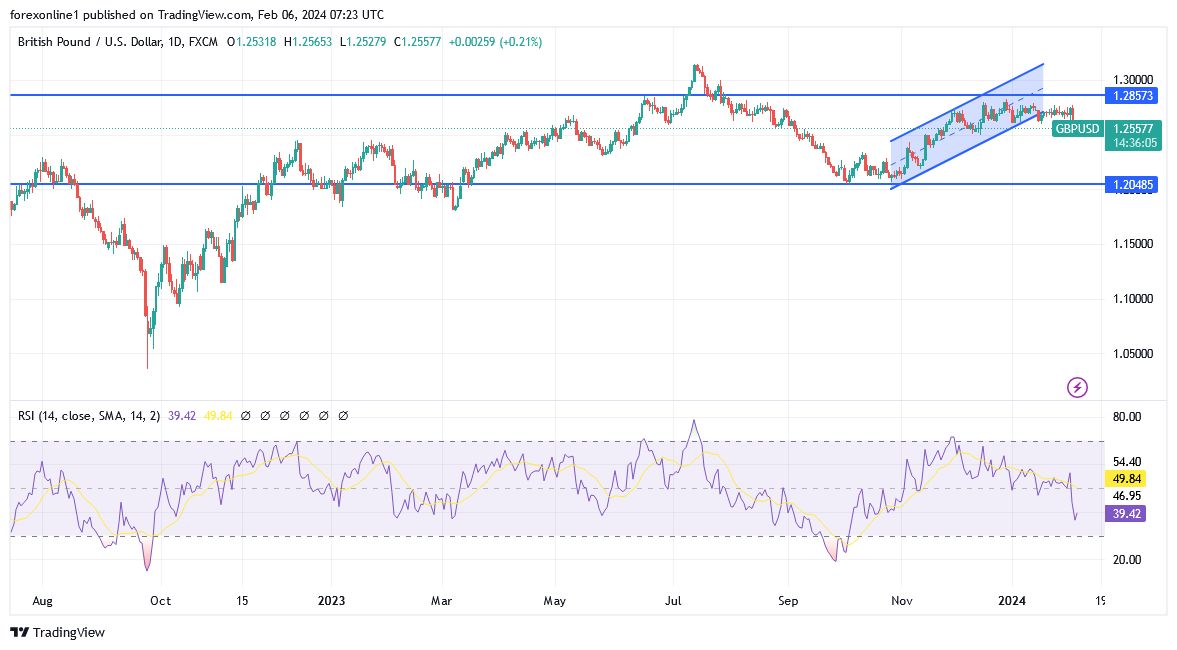
- Therefore, the GBP/USD pair was subjected to strong selloffs that pushed it towards the support level of 1.2518, the lowest level for the currency pair in nearly two months.
- Currently, it is stabilizing around 1.2560 at the time of writing the analysis.
(Click on image to enlarge)
Forex traders are wondering about the best place to buy the pound, and as we mentioned on the free live trading recommendations page, we repurchased the pound against the dollar from the support level of 1.2550. thus, if it moves down from that, there will still be buying levels but without risk.
Last week's trading ended with a strong blow to the US dollar after the release of what was described as the "insanely strong" US non-farm payrolls report, which revealed wage growth and job growth that exceeded expectations in January. As a result, the data buried the possibility of a US interest rate cut by the Federal Reserve in March, which led to a reversal in financial markets that included a rise in the dollar.
As a result, the gains in the US dollar pushed the GBP/USD exchange rate below the 50-day moving average, indicating that short-term momentum has shifted to the downside. At the same time, the pair is located at the horizontal support line at 1.2640, which provided significant support at various times in late 2023 and 2024. Moreover, we will look for this support line to hold if the short-term trading range is respected; last week, we reflected on how strong the GBP/USD's narrow trading range is, and we noticed a significant decrease in the pair's volatility, which created predictable trading conditions. Technically, the RSI indicator has deteriorated and indicates that momentum has shifted to the downside, and if the aforementioned support level is breached, it is possible to test the 1.25 level (December lows) thereafter. In case the support holds, it is possible to return to the top of the range at 1.2772-1.28, where the expected trading range exerts its attractiveness again.
Overall, the fundamental backdrop is shifting in favor of the dollar, as the pound fell by 0.90% after the US jobs report on Friday, indicating that the market has abandoned hopes of a rate cut in March. Commenting on this, Christopher Wong, currency analyst at OCBC Bank, says: “Speculators continue to bullish the US dollar, due to the non-farm payrolls report, which was a great success last Friday.”
According to the Economic Calendar data, the United States added a total of 353 thousand jobs in January, with job gains seen broadly across various industries, while the past two months of the non-farm payrolls report saw an upward revision of +126 thousand. Furthermore, wages jumped to a 3-month high of +4.5% y/y versus 4.1% previously.
Finally, the data conveys what the Fed was trying to say a few days before its February interest rate decision: “It is still too early to talk about interest rate cuts”. Moreover, the analysis by ING finds that the non-farm payrolls report contradicts other printed data indicating a slowdown in the US jobs market.
GBPUSD Expectations and Analysis Today:
GBP/USD price was trading sideways between support around the key psychological level of 1.2600 and resistance around 1.2775. Over the weekend, the price fell and may be ready to continue its downward momentum. Also, the 100 SMA appears to be completing a bearish crossover to confirm that selling is in order. In this case, GBPUSD may experience a decline at the same high as the range or 175 pips. Likewise, the price is trading below both moving averages as an early indicator of downward pressure. The Stochastic indicator is moving downward, so the price may continue to trend while sellers are in control. However, the oscillator is dropping into oversold territory to indicate exhaustion among GBP speculators.
At the same time, the Relative Strength Index has more room to slip before it reflects oversold levels, so the price may still have some downside. However, a shift to the upside could signal a return of bullish pressure soon and a possible recovery back to range resistance.
More By This Author:
GBP/USD Signal: Bears Prevail As Sterling's Harsh Reversal IntensifiesBTC/USD Signal: Bitcoin Consolidation Phase Continues
EUR/USD Forex Signal: Bearish Price Channel
Disclosure: DailyForex will not be held liable for any loss or damage resulting from reliance on the information contained within this website including market news, analysis, trading signals ...
more


