
GBP/USD Analysis: Bearish Bias Intact Under 1.37, Awaits FOMC, BOE
The analysis for the GBP/USD is bearish despite a decent upside attempt from the daily lows of 1.3646.
The GBP/USD price new four-week lows around 1.3600 midday during the early North American session but quickly recovered several pips.
The pair is trading in the 1.3675 area; the pair is still down nearly 0.50% for the day.
A faster-than-expected Fed tapering announcement and a risk reduction trend in the markets continued to support the US dollar. However, the GBP/USD pair subsequently fell for the third day in a row, marking the fourth decline in the past five days.
Initially, this week’s Bank of England meeting headlines appear to provide mixed information for the pound sterling. However, in light of declining expectations that the MPC will adopt a more hawkish tone, the economists do not anticipate any substantial gains for the pound after the rate announcement.
As market expectations rose, the dollar received support. This is because the Fed will inevitably discontinue its massive stimulus measures started during a pandemic. The recent rise in US Treasury bond yields further proved this point by causing the GBP/USD pair to fall.
In addition, the impetus of risk aversion in the market gave the dollar an additional boost as a safe haven. However, investors remain concerned about the rapidly expanding delta option and slowing global economic growth. That, along with concerns about the health of real estate giant China Evergrande Group, has impacted risk sentiment.
A recent downturn weakened the strong recovery the GBP/USD made from its monthly swing lows in August around 1.3600. In addition, the FOMC meeting on Wednesday and the Bank of England rulings on Thursday will be major traders’ focus points this week.
Investors will closely follow the two-day FOMC meeting results beginning Tuesday to determine when the Fed is likely to cut its bond purchases. Consequently, this will play a key role in swaying the US dollar’s near-term dynamics and providing fresh momentum to the GBP/USD pair.
GBP/USD Price Technical Analysis: Pullback Capped By 1.3700
(Click on image to enlarge)
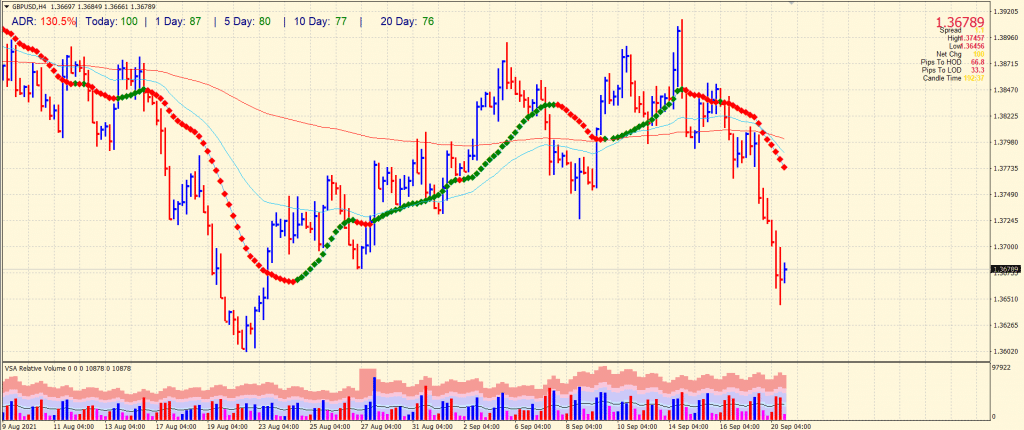
GBP/USD 4-hour price chart analysis
The GBP/USD price covered 130% average daily range so far. The volume is strongly bearish, and any upside attempt may find resistance around 1.3700 ahead of 1.3745. However, the turning point for the bulls will be the 1.3800 level which is too far to break. On the downside, the daily lows of 1.3646 may provide immediate support ahead of YTD lows of 1.3600.
Disclaimer: Foreign exchange (Forex) trading carries a high level of risk and may not be suitable for all investors. The risk grows as the leverage is higher. Investment objectives, risk ...
more
Comments
 No Thumbs up yet!

