Fundamentals Supportive But Watching Support Zones Closely
Before we get to our weekly review of market fundamentals, I thought it would be a good idea to check in on the state of the current pullback happening in the stock market.
Now in its 11th day, the current pullback in stocks continues to look like a typical, garden-variety correction (well, to me, anyway). Through Thursday's close, the S&P 500 has pulled back -6.25% from its September 2nd high. The Nasdaq Composite has shed -9.5%. However, the Dow is off -4.1% and the beleaguered Russell 2000 small caps are just -3% from their recent high-water marks for this cycle.
The reason for the disparity between the indices is simple. The leaders are giving back some of the spectacular gains seen in August and calendar year 2020, while the laggards didn't have any real excess to give back. As such, they have so far avoided the ire of the sellers for the most part.
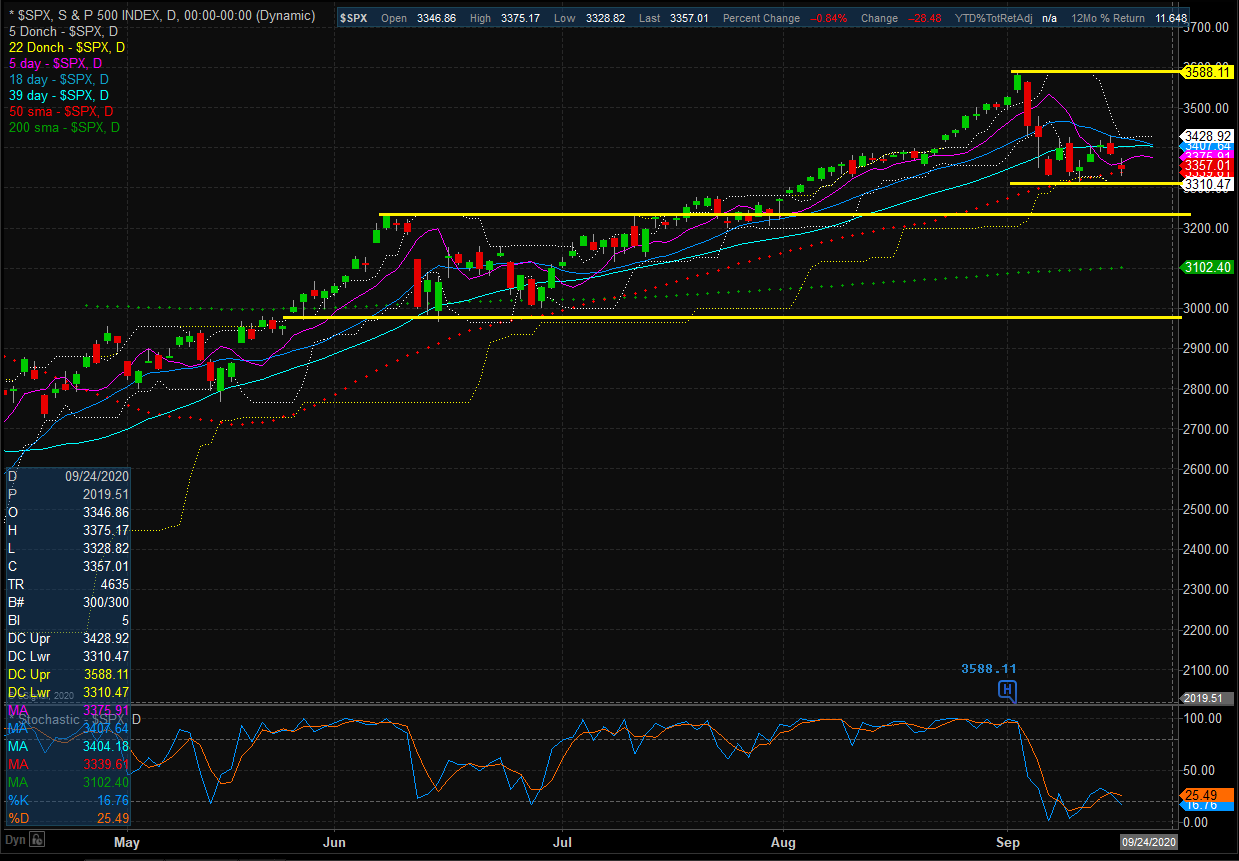
The questions of the day from a short-term perspective are, (a) where are we now and (b) does the decline have farther to go? I think the chart of the S&P 500 can help us here.
S&P 500 - Daily
(Click on image to enlarge)

In short, all the major indices remain above their respective support zones (the second yellow line from the top). This is a good thing as it indicates that the bulls have been able to put in a stop. For now, anyway.
However, the technical analysis textbooks tell us that the more times a support zone is tested, the weaker it becomes. And with the current count of the number of tests of support currently at three (and arguable #4 if you include this morning's early action), we should recognize that the bears are hardly back on the sidelines and that the support zone could certainly still break.
Couple this with the fact that which show that the week after the September Quadruple Witching Expirations have been historically weak (hat tip here to the fine work from Quantifiable Edges author Rob Hanna) and I think it makes sense to be prepared for another meaningful test of support.
So, in looking at the chart, if the current support fails, the next area that could possibly present line in the sand for the bulls is around 3325. And then down around 2975. From my seat, these are the important zones to watch should the bears find a way to push prices down through the current support.
The State of the Fundamental Models...
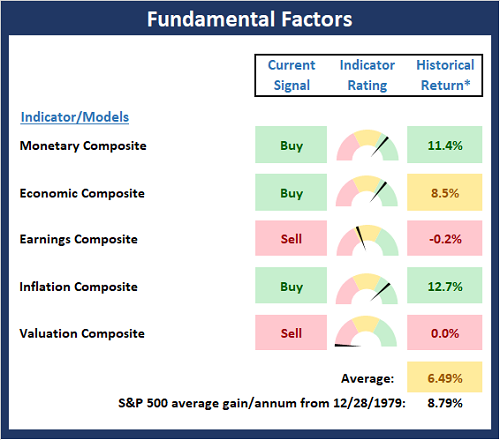
There are no changes to the Fundamental Factors board again this week. To review, Monetary conditions remain positive (and the components of the composite actually improved a bit last week, taking the hypothetical historical annual return from +7.4% to +11.4%), the economic composite is holding steady, earnings remain ok (for now), inflation remains something to watch, and valuations continue at extremely high levels. All in, my take is the board continues to favor the bulls from a big-picture, intermediate- to long-term standpoint.

* Source: Ned Davis Research (NDR) as of the date of publication. Historical returns are hypothetical average annual performances calculated by NDR.
Thought For The Day: When in doubt, just take the next small step...
The opinions and forecasts expressed herein are those of Mr. David Moenning and may not actually come to pass. Mr. Moenning's opinions and viewpoints regarding the future of the markets should ...
more


Also, keep in mind that one item that has a great deal of effect on stock prices is emotions of those doing the buying and selling, as well as the emotions of those pretending to have great insight into what is happening. And how reliable and predictable are the emotions of such folks???. While actions can be observed and possibly some clues gained, emotions are less predictable than tomorrow;s winds.