Freak-Out Mode Is Back
Good Monday morning and welcome back. On Friday, investors were reminded of why September is known for volatility. And with the computers likely cued up and waiting for a reason – any reason – to sell stocks, current route would appear to be self-fulfilling to a certain degree. However, the bottom line is the market is back in freak-out mode.
At issue is the idea that the world’s central bankers are ready to begin backing away from their overly accommodative monetary policy. More specifically, that here in the U.S., FOMC governors are scurrying around trying to prepare the market for a September rate hike.
But before we get into a tizzy about the end of the great bond bull or what comes next from the Fed, let’s step back start the week with a review of the state of the market and our objective, disciplined major market indicators/models.
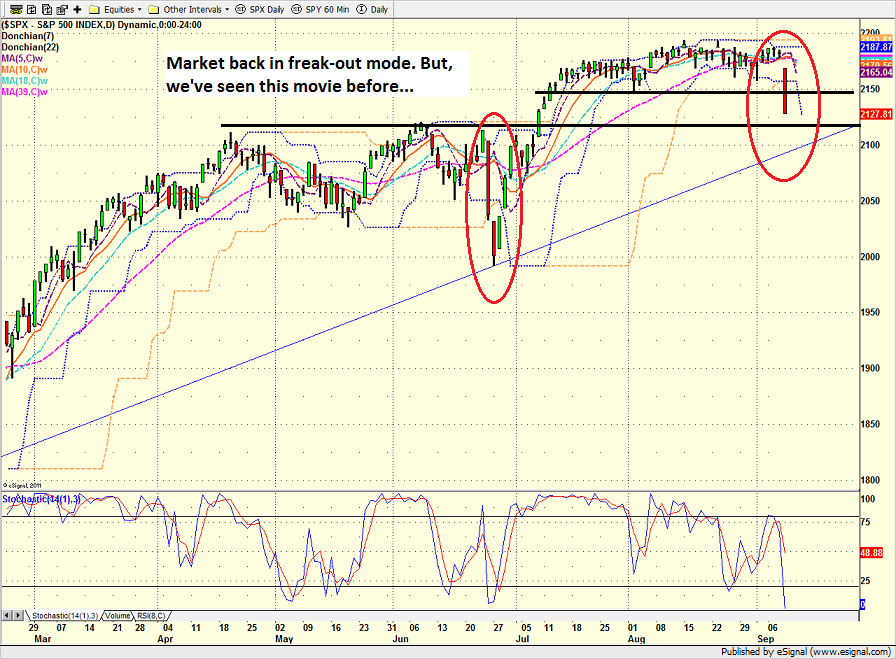
The first step is a review of the price/trend of the market. Here’s my current take on the state of the technical picture…
- Yep, that’s right, stocks are freaking out again
- Technical levels snapped like toothpicks on Friday
- Short-term support was broken
- Moving averages – which are all in the same place right now – were broken
- Bears suggest this is just the beginning
- But, how’d that turn out last time?
- However, a break of the uptrend line drawn on the chart would be a pretty big deal
S&P 500 – Daily
(Click on image to enlarge)
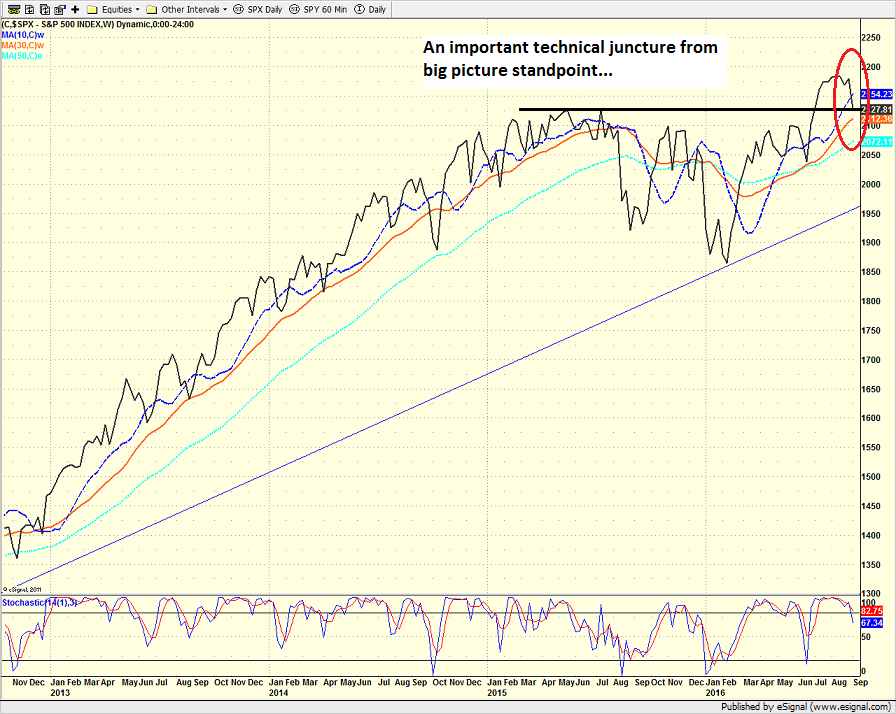
From a longer-term perspective (e.g. looking at a weekly chart of the S&P 500)…
- I’ve been saying for weeks that the bulls “had some room to work with” from a longer-term perspective
- IMO, that is exactly what is happening now
- Key support in this “area” on a weekly chart now being tested
- Exact levels don’t matter – it is the action around those levels that matter
- S&P broke below 10-week but still above 30-week
- A close meaningfully below 2037 on a weekly basis would be a reason to worry
- P.S. We’ve been saying to be ready with a plan to buy the dip. THIS IS THE DIP. (But when it ends is another question entirely!)
S&P 500 – Weekly
(Click on image to enlarge)
Next, let’s look at the “state of the trend” from our indicator panel. These indicators are designed to give us a feel for the overall health of the current short- and intermediate-term trend models.
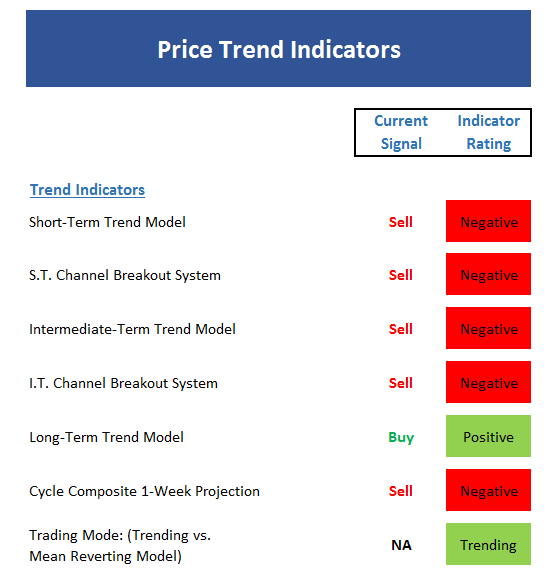
- This board sure turned red in a hurry
- The only positive is the long-term trend
- The short-term trending-vs-mean reverting model flipped to mean reverting (but this is a 2-out-of-3 model and the other two remain in trending mode)
- The “quick flip” on this board is due to the extended sideways period followed by a big dive
- IMO, technical levels become less important each month in the market (too many people/computers all looking at the same thing)
Now we turn to the momentum indicators…
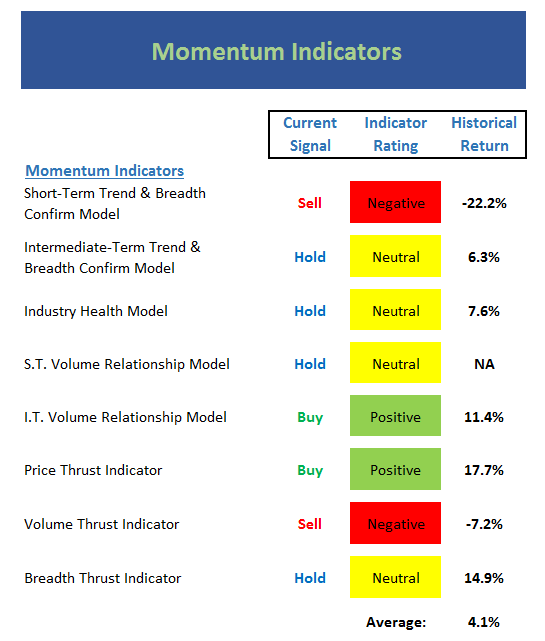
- The momentum board is now sloppy and largely neutral
- Short-term indicators have downtick
- Longer-term indicators still okay
- Important to note that momentum had waned before the latest freak-out began
- In addition, recall that the Industry Health model had basically REFUSED to turn bright green during the latest move off the bottom. I’ve mentioned several times that this was something to pay attention to (during big, meaningful moves, this model should be solidly positive).
- Note: I remain concerned that market momentum is being unduly influenced by the high-speed traders all making the same trade at the same time – and then reversing
Next up is the “early warning” board, which is designed to indicate when traders may start to “go the other way” for a trade.
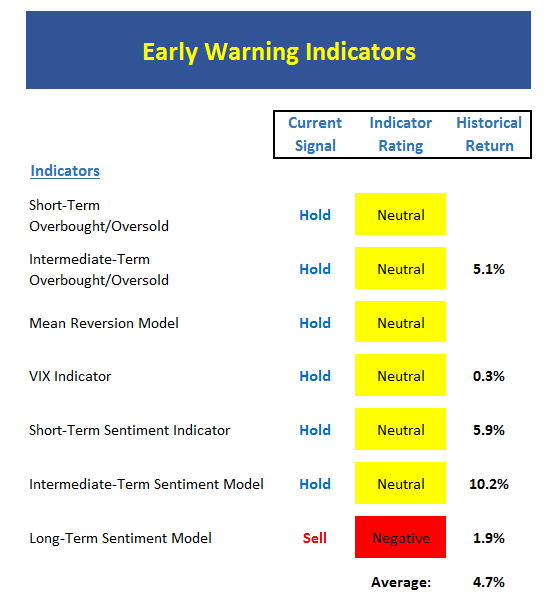
- Bam. Just like that, the early warning board is waving the yellow flag.
- This tells us that the next rally is now being “set up”
- Bottom line takeaway from the board at this time is: NOT YET!
Now let’s move on to the market’s “external factors” – the indicators designed to tell us the state of the big-picture market drivers including monetary conditions, the economy, inflation, and valuations.
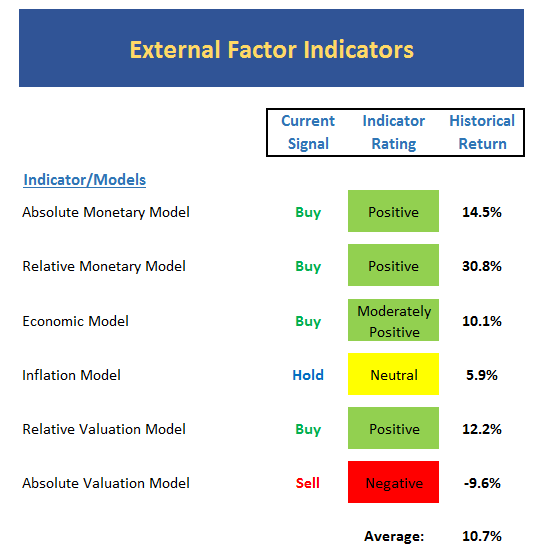
- While most fast-money/trader types are bracing for a further selloff, our external factor board hasn’t budged
- But given last week’s spike in interest rates, I would expect our monetary models to begin to sit up and take notice if the move continues.
- At this point, the monetary models suggest the 3-day move in bond yields is “just noise”
- The Economic model hasn’t changed
- The Inflation model hasn’t changed
- Absolute valuation remains a problem
- All in, the model board suggests above-average long-term returns
Finally, let’s review our favorite big-picture market models, which are designed to tell us which team is in control of the prevailing major trend.
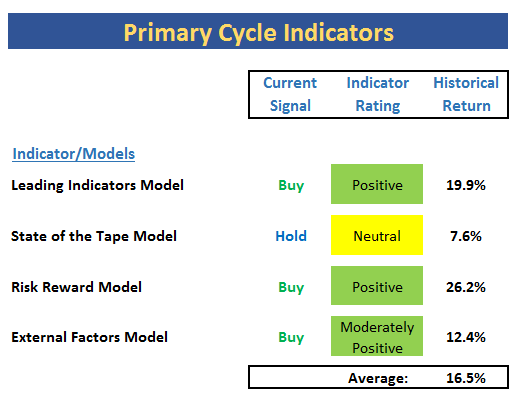
- Not much change here…
- The “State of the Tape” model remains in neutral mode
- The External Factors model hasn’t changed modes yet but continues to downtick modestly.
- The combination of models continues to sport bull-market historical returns.
The Takeaway…
Welcome back to the way the investing game is played in a globally connected world where trading is controlled largely by computer algorithms. The bottom line here is that traders are all making the same moves at the same time via their pre-programmed machines. And with September having a history of volatility, it is not at all surprising to seem a big bout of “vol” suddenly show up. On one hand, I can argue that Friday’s action looks like the beginning of the yet another waterfall decline. After all, this particular freak-out is based on rates spiking and until that trend changes, we should probably expect more selling. But on the other hand, I can also say that the current drive IS the dip that we’ve been talking about for weeks. Thus, anyone looking to buy the dips should be watching and waiting for this thing to end, AND getting ready to move. But when that occurs, of course, is anybody’s guess!
Current Market Drivers
We strive to identify the driving forces behind the market action on a daily basis. The thinking is that if we can both identify and understand why stocks are doing what they are doing on a short-term basis; we are not likely to be surprised/blind-sided by a big move. Listed below are what we believe to be the driving forces of the current market (Listed in order of importance).
1. The State of Global Central Bank Policies
2. The State of U.S. Economic Growth
3. The State of the Global Bond Market
4. The State of the U.S. Dollar
Thought For The Day:
You’re never a loser until you quit trying. - Mike Ditka


Thanks for sharing