

CPI data from the BLS, PCE data from the BEA, chart by Mish.
Inflation Chart Notes
- PCE represents the Personal Consumption Expenditures price index. This measure is from the Bureau of Economic Analysis (BEA).
- CPI is the Consumer Price Index. The CPI is from the Bureau of Labor Statistics (BLS).
- Core for both indexes means excluding food and energy.
The CPI only counts expenses directly paid by consumers. The PCE includes items paid on behalf of consumers.
The PCE thus overweighs medical expenses paid by employer health benefit, Medicare, and Medicaid. The CPI overweighs housing related expenses.
Inflation Matters, Not Just Consumer Inflation
Neither the CPI nor the PCE directly includes home prices. It’s a huge mistake to not consider home price inflation (asset inflation in general) in any measure.
Including home prices, inflation had been booming for years. Economists, including the Fed, ignored this inflation.
Case-Shiller Home Price Indexes, the CPI, Rent, and OER
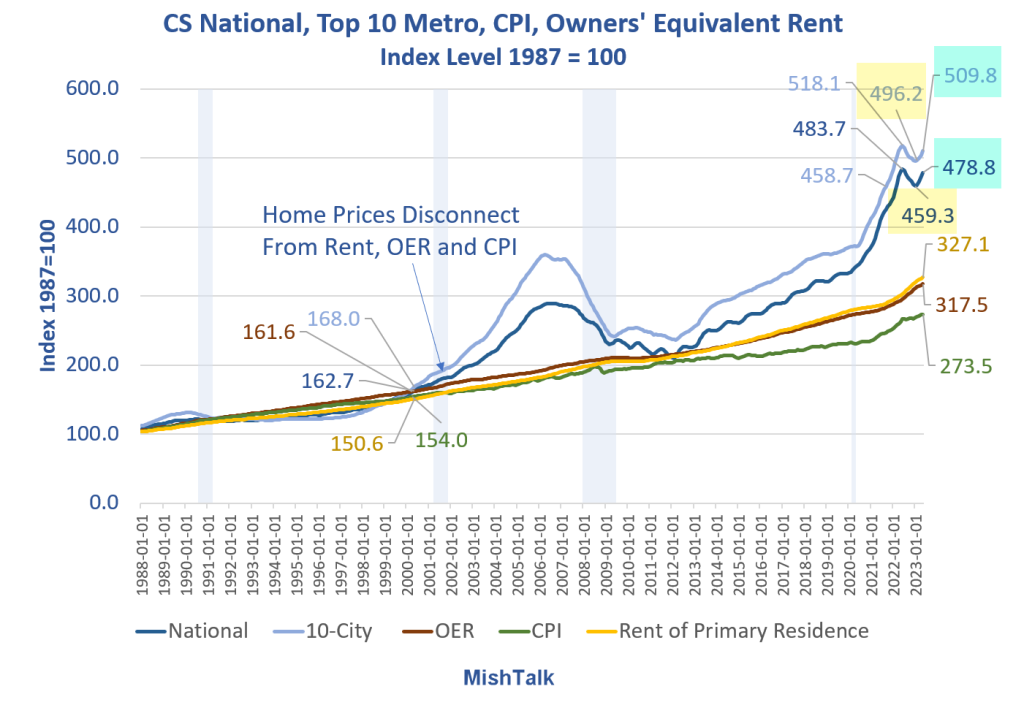
Case Shiller National and 10-City home prices indexes plus OER, CPI, and Rent indexes from the BLS.
Case-Shiller Chart Notes
- The latest Case-Shiller home price indexes is for May. It represents repeat sales of the same house in roughly a March-April timeframe.
- OER stands for Owners’ Equivalent rent. It’s the price one would pay to rent one’s own home, unfurnished, without utilities.
- CPI is the consumer price index.
- Rent of primary resident is just what it sounds.
- CPI, OER, and Rent as as measured by the Bureau of Labor Statistics (BLS).
Home prices wildly disconnected from the CPI in 2000 and in 2013. The disconnect accelerated in 2020 thanks to the Fed’s QE program and artificially holding interest rates ridiculously low.
Inflation matters, not just consumer inflation. Three rounds of massive fiscal stimulus compounded problems for the Fed.
Personal Current Transfer Receipts
![]()
Personal Current Transfer Receipts (PCTR) data from the BEA, chart by Mish.
Free Money
Personal Current Transfer Receipts are income from which no services were performed. Medicare, Medicaid, food stamps, Social Security, and three rounds of free money fiscal stimulus during the Covid pandemic are examples.
When you hand out sudden, massive, amounts of free money, expect inflation. And that is just what happened.
The free money rolls on. Prior to the pandemic PCTR was $3.2 trillion, annualized. It’s now $4.1 trillion.
Real PCTR was $2.9 trillion and is now $3.2 trillion. Thanks to inflation, free money does not buy as much as it used to. Fancy that.
Real Personal Spending Rises Twice as Much as Income in June
For discussion of the latest spending and income numbers, and personal consumption expenditures in billions of dollars, please see Real Personal Spending Rises Twice as Much as Income in June.
The Housing Bubble, as Measured by Case-Shiller, Is Expanding Again
Also note that The Housing Bubble, as Measured by Case-Shiller, Is Expanding Again.
Meanwhile, the Fed is watching the PCE, seemingly oblivious to the massive asset bubbles in housing and the stock market that it helped create.
More By This Author:
Real Personal Spending Rises Twice As Much As Income In JuneReal GDP Beats Expectations, Rises 2.4% In First Estimate For 2023 Q2
Fed Hikes Key Interest Rate To 5-1/4 To 5-1/2 Percent, Highest In 22 Years


Comments
Log in or sign up to join the conversation.