
Through June:
A comparison of conventional year-on-year vs. instantaneous.
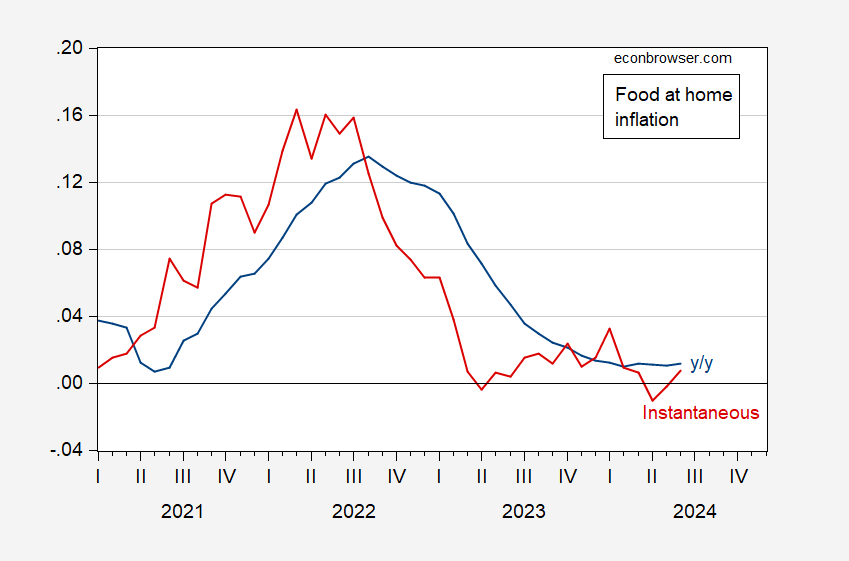
Figure 1: Food at home CPI component, y/y (blue), instantaneous per Eeckhout (2023), T=12, a=4 (red). Source: BLS and author’s calculations.
The Midwest and subregion East North Central (which includes Wisconsin) are showing modest declines q/q.
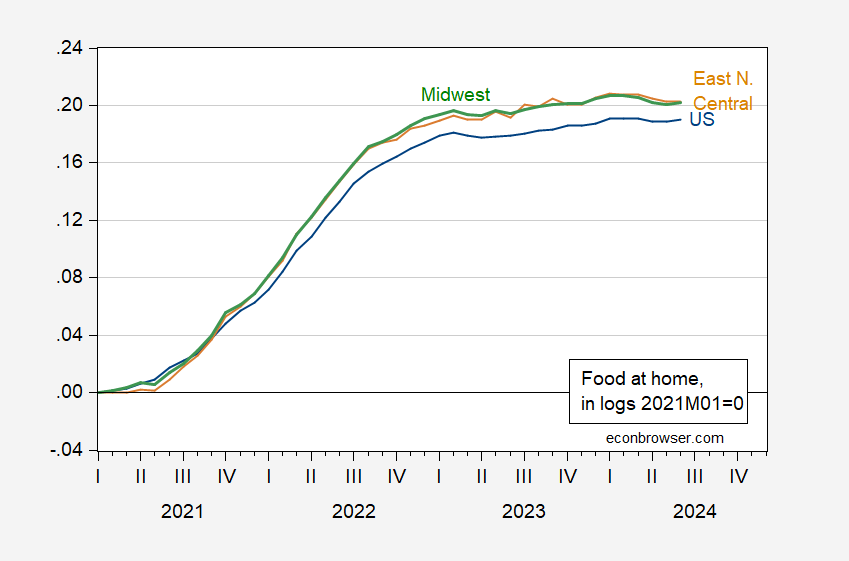
Figure 2: Food at home component of CPI national (blue), Midwest (B/C cities) green, and East North Central (tan), all in logs, 2021M01=0. Midwest and East North Central series seasonally adjusted by author using X-13 log transformed. Source: BLS, and author’s calculations.
More By This Author:
China Economic Sentiment
Recession Probabilities For June 2025
China GDP News, And A View On Chinese Medicine


Comments
Log in or sign up to join the conversation.