
FOMC, Earnings & Delta: Weekly Nifty 9
Every week, Finom Group (for who I am employed) constructs a weekly Research Report for investors. The following materials are excerpts from our weekly Research Report. Our goal is to deliver and touch upon all disciplines of investing/trading paradigms such as technicals, fundamentals, and quantitative studies. Enjoy!
Research Report Excerpt #1
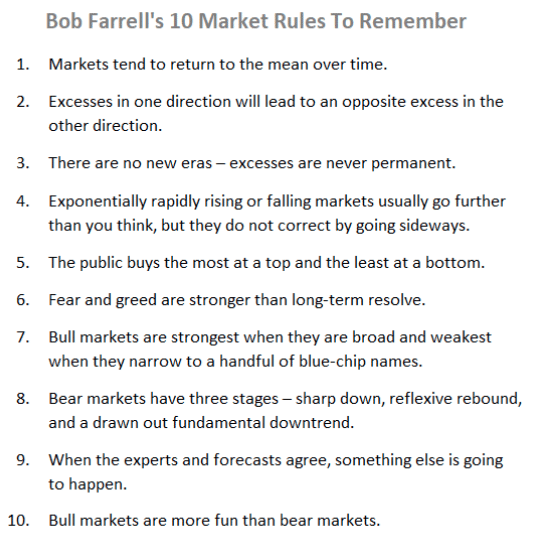
Year-end gets nearer with each passing week. Month-end is always a good time to review one’s goals for the year and possibly look at where you proved successful in the first half of the year and where opportunities have popped up for potential course correction. When you’ve mastered the exercise of monthly, quarterly and bi-annual review, I’d also suggest incorporating some of Bob Farrell’s market-wise Market Rules, as shown below:
Research Report Excerpt #2
Year 2 of new bull markets, human behavior tends to elicit greater price volatility and a bigger drawdown for the S&P 5000.
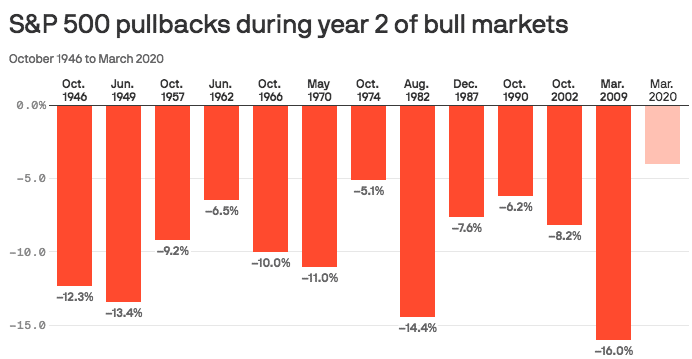
By the numbers: The S&P 500 bottomed on March 23, 2020, which means we’re 4 months into year 2 of the bull market.
- Since 1945, the average bull market saw a max drawdown, or its largest peak-to-trough sell-off, of ~10% during year 2, according to BMO Capital Markets.
- These drawdowns ranged from down 5.1% to 16%.
- Since March 23, 2021, the S&P has seen a max drawdown of just 4.2%.
Research Report Excerpt #3
To finish the trading week, S&P 500 breadth did improve greatly from the previous week. A key barometer of the interim breadth trend or health of the interim trend comes from understanding the % of stocks trading above their 50-DMA, which rose back above 50% this past week.
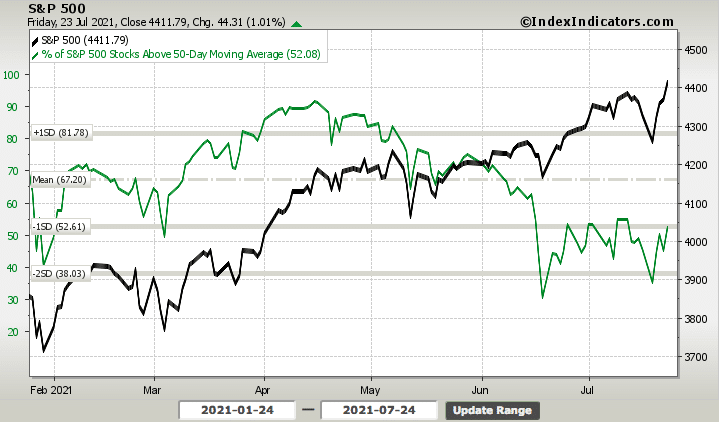
Unfortunately, the % of stocks trading above their 50-DMA is not meaningfully above 50%, which does denote underlying price sensitivity and vulnerability going forward. Essentially, investors should remain on their “toes”, vigilant but not fearful. The Nasdaq % of stocks above their 50-DMA remains under 50%, and at 35%, even more vulnerable to sudden selling pressure.
Research Report Excerpt #4
The rotation from small and mid-caps to large-cap/growth has been in place since mid-March. We can see this in a relative performance ratio chart of the small-cap ETF (IWM) compared with the S&P 500 ETF (SPY).
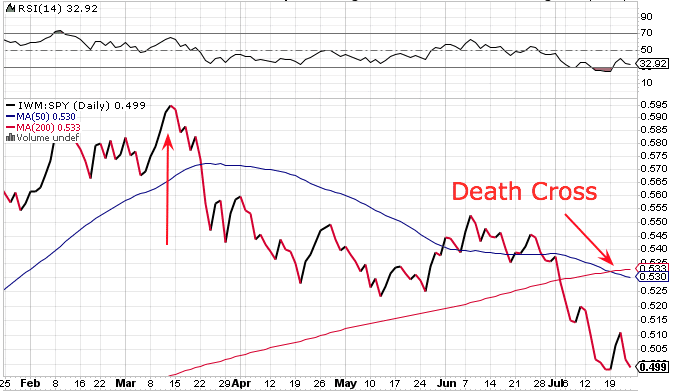
As identified in the IWM:SPY relative performance ratio above, mid-March marked the peak in outperformance for small-caps and the transfer of leadership back to large-caps. This is actually a normal and to-be-expected occurrence as small-caps typically lead out of bear markets and large caps follow. What is also identified in the chart above is the “Death Cross” in the relative performance ratio whereby the 50-DMA crosses under the 200-DMA. Typically when a Death Cross occurs, more weakness is ahead. Keep in mind that we are examining a relative performance ratio between small and large-caps, not an absolute picture of the small-cap ETF.
Research Report Excerpt #5
The leading index rose 0.7% to 115.1 in June, another new record high. This extends the gains for a fourth straight month and follows May’s 1.2% increase to 114.3 with jumps of 1.3% in April and 1.4% in March. Eight of the 10 components made positive contributions, again led by jobless claims (0.25%) and ISM new orders (0.21). The two components making negative contributions were building permits (0.15%) and the average workweek (0.14%).
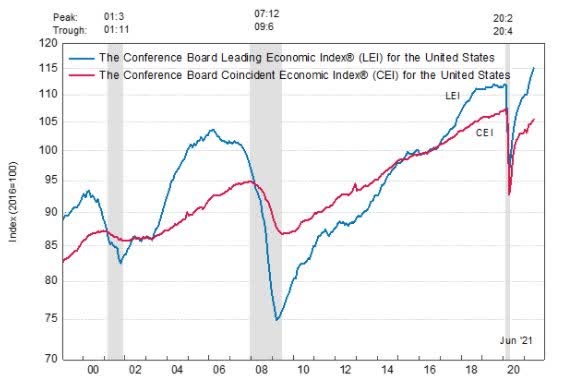
The Leading Economic Index increased 5.0% (about a 10.3% annual rate) during the first half of 2021, slower than the growth of 6.6% (about a 13.7% annual rate) during the second half of 2020. This slowing of growth, while still yet above the average of typical recovery cycles, is only natural given the higher base. What’s more important, is how the LEI strength can potentially foreshadow stronger earnings and therefore lends itself quantitatively to deciphering S&P 500 forward returns.
- When LEIs >+7% YoY, as they are today, S&P 500 6-month forward returns +7.7%.
- Win-ratio is 82%.
Research Report Excerpt #6
While there is not an expected shift in policy or messaging at the upcoming FOMC meeting and rate announcement, discussions about the pace and composition of the Fed’s bond-buying will continue. Still, Fed Chair Powell was speaking for the central bank when he told Congress recently that the bar to adjust the purchases (substantial further progress toward the Fed’s targets) has not been met. The Jackson Hole symposium at the end of August has long been seen as the first realistic window of opportunity for the Fed to signal its intention to slow, possibly alter the composition of its bond purchase program, and shape it more formally at the September FOMC meeting. The September meeting offers the Fed an opportunity to gradually begin messaging its tapering plans and/or intentions.
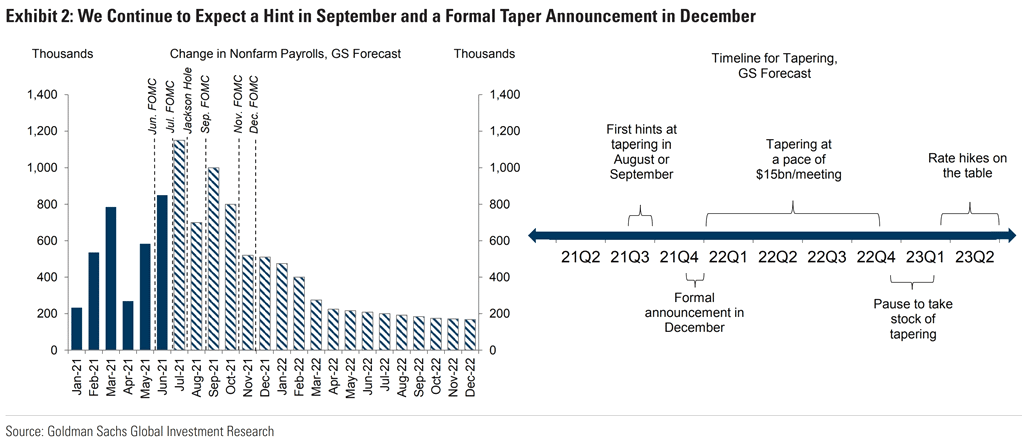
Reporters may try to draw Powell out but are unlikely to have much more success than the U.S. Senators and Representatives. There is ongoing interest in the size of the reverse repo facility, for which the Fed now pays five basis points at an annualized rate, the same as a 6-month bill. In addition, Powell pushed back against suggestions by some officials that the central bank’s MBS purchases are lifting house prices beyond the access of many American families.
Research Report Excerpt #7
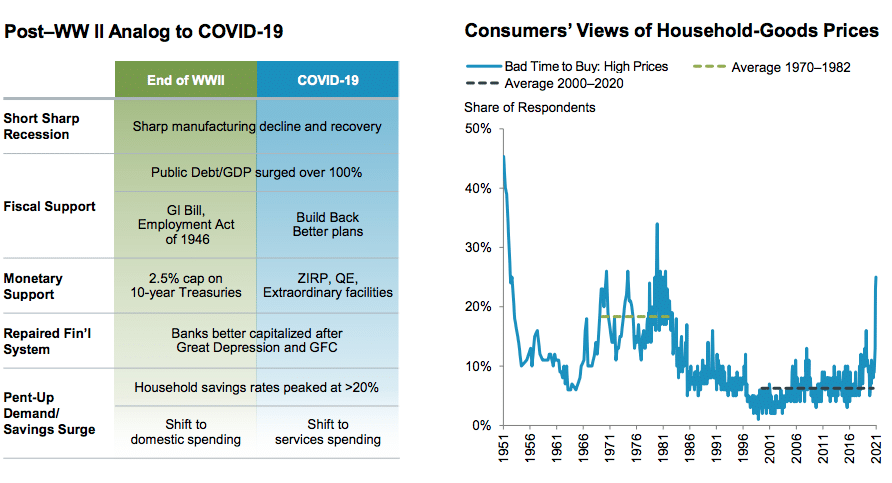
The post-COVID era economy is developing along the lines of the post-World War II economy. The post–World War II shift to a peacetime economy, which catalyzed a cyclical rebound of growth and inflation, may be the closest historical analog to the post-COVID era. Strong postwar demand from healthy consumer balance sheets combined with a lagged supply response created upward pressure on prices.
Research Report Excerpt #8
Just last week, FactSet was tracking 69% YoY EPS growth for the Q2 2021 period. That tracking has already jumped 5% in the first couple of weeks of earnings season, and before the FAANMG stocks even report.
Insight/2021/07.2021/07.23.2021_EI/sp500-earnings-growth-q2-2021.png?width=920&name=sp500-earnings-growth-q2-2021.png)
Just a heads-up, the current rate of EPS growth will not be the realized growth rate by the end of reporting season. Finom Group would anticipate another 8-12 percentage point rise in the quarterly EPS growth rate from here (82-86% YoY EPS growth).
Research Report Excerpt #9
Moreover, while the debate of market valuations is never-ending and tireless, it is always best to have a thesis as to why market valuations are elevated. The reality is that in a cap-weighted index, and if that index is more heavily weighted toward growth stocks, the index will favor the trend of the earnings growth in those growth stocks. For the last decade+, growth stocks have indeed delivered above and beyond the expected earnings growth, which has served to slowly grow the S&P 500’s P/E multiple. If we subtracted the FAANG stocks, the P/E multiple would actually normalize toward 10-yr. average P/E multiple.
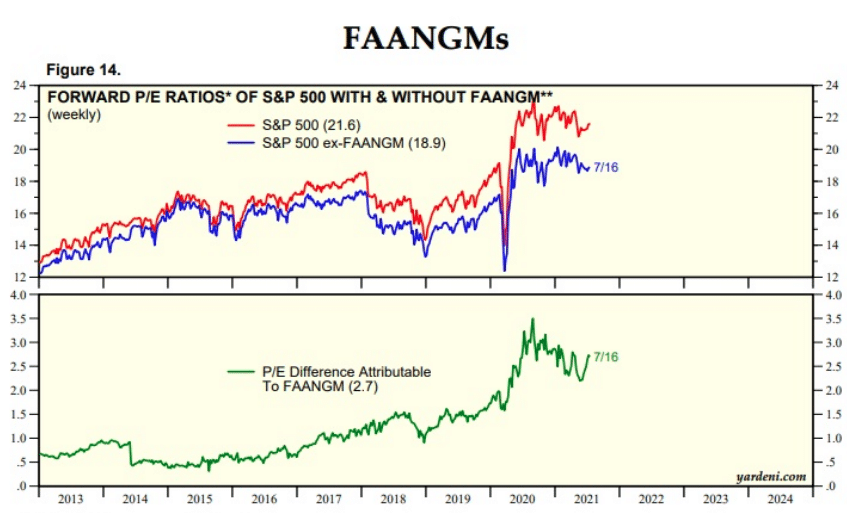
As we can see from the example above, with FAANMG, the S&P 500 P/E is right around 21.5X FWN12M EPS (Forward Next 12-months). If we subtract FAANMG it comes down to 18.9X FWN12M EPS. Ex-FAANMG would still express expanding P/E multiple over a 10 and 20-year period for the S&P 500, which is also what P/Es do given the quarterly rebalancing of the S&P 500 in favor of growth stocks, while the supply of shares dwindles over time.
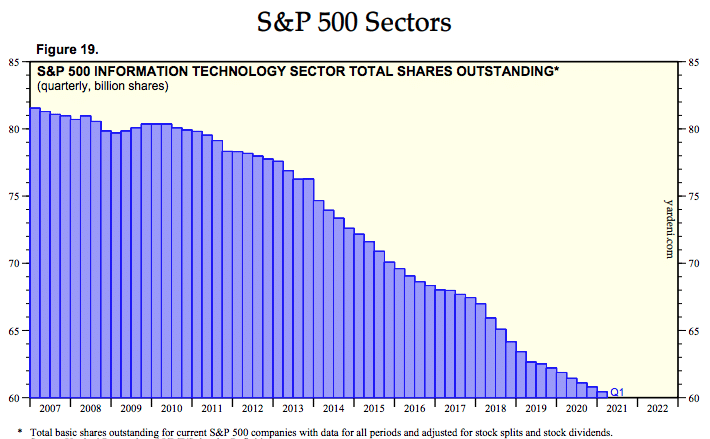
There is a logical reason as to why the S&P 500 rebalances on a quarterly basis and is in favor of growth stocks. The index will perform that much better given such structural composition. Least we forget, there not making too many more of these growth stocks that are able to grow their revenues some 15-20% annually! Back in the Dotcom era, certainly, there were many that proposed to do so, but since then, that number has consistently shrunk.
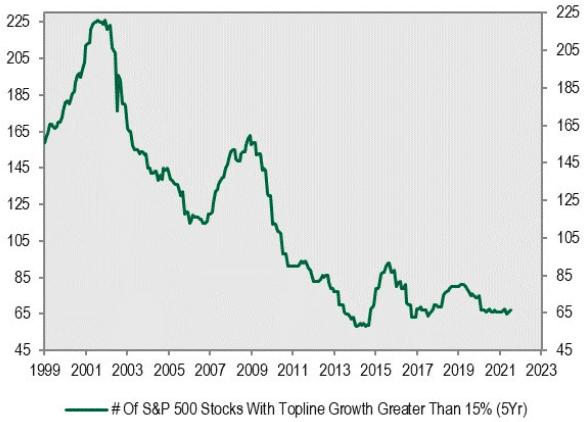
- Scarcity premium doesn’t just apply to Bitcoin!
- Why are growth stocks so expensive today? One reason is that there aren’t many of them!!
- During Dotcom period, nearly 1/2 of the market could have been classified as growth stocks, compared to a meager 67 today.
- Scarcity creates a premium.
Disclaimer: The risk of loss in stock, stock/options, futures, futures/options, and forex trading is substantial, and site visitors and subscribers should consider whether trading these markets ...
more

