Final Resistance For Gold & Silver
Image Source: Unsplash
Gold has pulled back after a mini-blow-off on Monday that followed a new monthly and weekly all-time high.
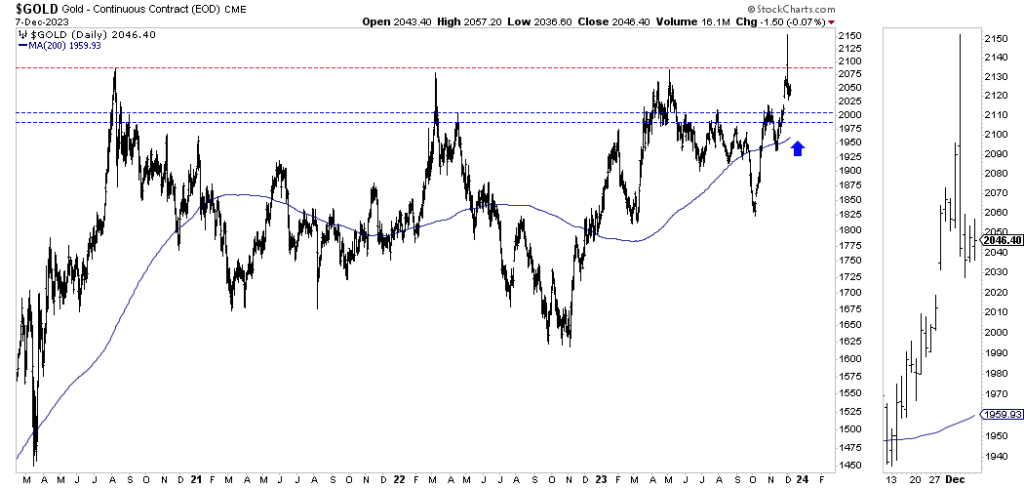
It had cleared monthly resistance at $2000 and weekly resistance near $2030 before surging intraday to over $2100. Gold has settled in the $2000s with strong support, around $2000.
Although Gold has not broken out on the daily chart, the monthly and weekly breakout is more significant and implies a daily breakout will eventually follow.
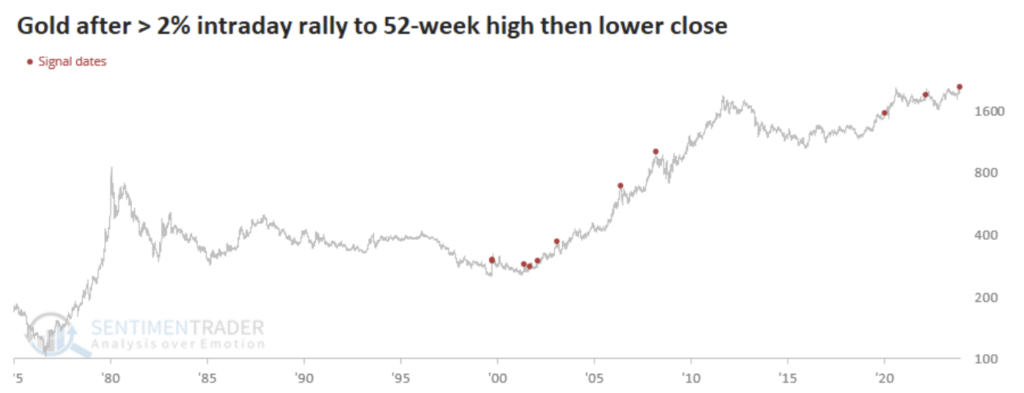
SentimenTrader.com published a chart that can give us insight into the time of eventually.
This chart plots points at which Gold hit a new 52-week high but reversed lower as much as 2% or more.
These points include multiple points from 2001 to 2003, the 2006 and 2007 interim peaks, a peak before Covid, and one in early 2022.

The points in 2001, 2002, and 2003 are the best comparisons because those were early in a new secular bull market, and the gold price was much less overbought than in 2006 and 2007. Those four points bottomed at or around the 200-day moving average one or two months after the reversal.
Gold has support at $1985 to $2000, and its 200-day moving average, at $1960, should reach $1985 in January 2024. Also, note the last line of resistance near $2100.

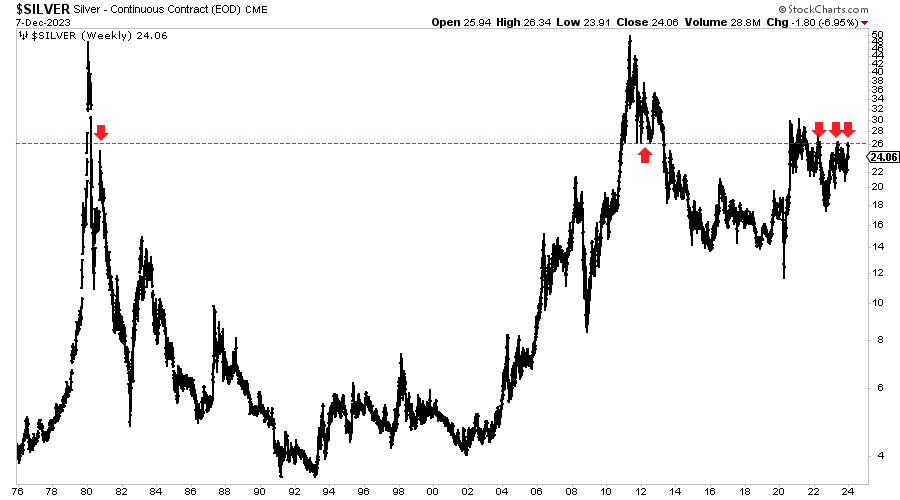
It is easy to see why $2100 is the last stand for Gold bears. Why $26 is the last stand for Silver is more nuanced.
The $26 level is an important historical pivot point (first rally after the 1980 crash, major support after the 2011 peak, and resistance over the past two years) and marks the 50% retracement of the move from the all-time highs to early 1990s lows.
A clear break of $26 projects to a measured upside target of $33-$34, and there is very little resistance to $50.

Gold has already made a new monthly and weekly all-time high, but there is no looking back once the market clears $2100.
And that breakout will lead to Silver breaking above $26.
These are the final resistance levels before a full-blown, raging bull market in precious metals.
Get positioned during this weakness because share prices could accelerate much higher before next spring.
I continue to focus on finding high-quality gold and silver juniors with 500% to 1000% upside potential over the next few years.
More By This Author:
This Indicator Shows If Gold Is In Secular BullGold Breakout & Road To $2300 & $2500
Gold New Daily, Weekly, Monthly All-Time High
Disclosure: None


