Thursday, March 2, 2017 1:03 PM EST
Why do we use Fibonacci retracements at times and so should you?
Because as you'll see below they tend to act as support zones much like trendlines and moving averages do. We've seen it time and time again and the chart below shows this to be true.
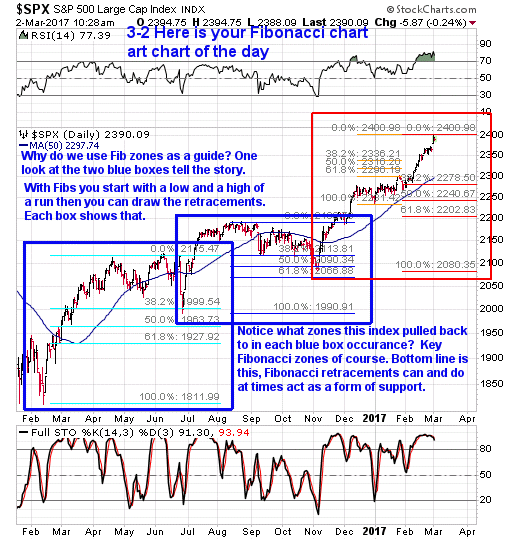
Now that we've keyed in on the blue boxes and chart notes in the chart above lets talk about the red box.
Within that red box we see multiple Fibonacci retracements shown. Remember when applying Fibonacci retracements you need a markable high and markable low as your reference points.
In the chart below what I've done is zoomed in on the red box from the chart above.
(Click on image to enlarge)
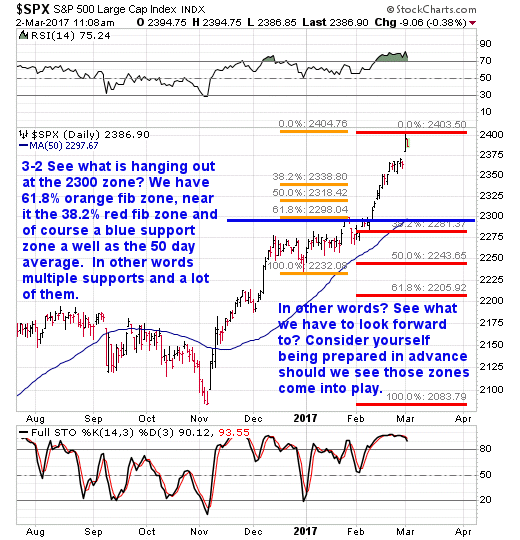
If yesterday's high is a markable high for the time being, then we can apply retracements as a guide to see based upon where Leonardo De Pisa (founder of Fibonacci) sees support zones.
Notice what is hanging out in the 2300 zone? If you said support you are correct. So at that level not only do we have classic technical analysis chart supports via trend lines and the 50 day we also have a Fibonacci cluster to give us a clue as to a pretty serious support zone to be aware of in the future. Like I've said, one always wants to know where support zones are in advance.
Disclosure: None.
Disclaimer: THESE ARE NOT BUY RECOMMENDATIONS! Comments contained in the body of this ...
more
Disclosure: None.
Disclaimer: THESE ARE NOT BUY RECOMMENDATIONS! Comments contained in the body of this report are technical opinions only. The material herein has been obtained from sources believed to be reliable and accurate, however, its accuracy and completeness cannot be guaranteed. Amazing Power Patterns reserves the right to refuse service to anyone at anytime for any reason. Amazing Power Patterns is not an investment advisor, hence it does not endorse or recommend any securities or other investments. Any recommendation contained in this report may not be suitable for all investors and it is not to be deemed an offer or solicitation on our part with respect to the purchase or sale of any securities. All trademarks, service marks and trade names appearing in this report are the property of their respective owners, and are likewise used for identification purposes only. The member/subscriber agrees that he/she alone bears complete responsibility for his/her own investment/trading decisions. Amazing Power Patterns.com and all affiliates shall not be liable to anyone for any loss, injury or damage resulting from the use of any information. Trade at you're own risk, this information is strictly for educational and informational purposes only. Amazing Power Patterns.com and all affiliates assumes NO responsibility whatsoever for any losses experienced by anyone who uses its educational materials to make financial decisions. All charts courtesy of stockcharts.com
Want to know more? Visit our website. Have you enjoyed good results from our newsletter or have a comment or question? Contact us at customercare@amazingpatterns.com We'd love to hear from you. If you enjoy these newsletters, tell a friend!
less
How did you like this article? Let us know so we can better customize your reading experience.


Thanks for sharing