Federal Budget: May Deficit Soars To Almost 3x Above Average
The Federal Government publishes the spending and revenue numbers on a monthly basis. The charts and tables below give an in-depth review of the Federal Budget, showing where the money is coming from, where it is going, and the surplus or deficit.
This month saw a $347B deficit, the largest monthly deficit since March of 2023.
(Click on image to enlarge)

Figure: 1 Monthly Federal Budget
This was also the second largest May ever, only behind May 2020 during the very depths of the pandemic.
(Click on image to enlarge)

Figure: 2 Historical Deficit/Surplus for May
On average, May experiences a deficit of -$127B which makes this year almost 3x larger than typical May deficits!
(Click on image to enlarge)

Figure: 3 Current vs Historical
The two Sankey diagrams below show the distribution of spending and revenue for the month and the trailing twelve months.
(Click on image to enlarge)

Figure: 4 Monthly Federal Budget Sankey
(Click on image to enlarge)

Figure: 5 TTM Federal Budget Sankey
The next two charts show the monthly revenue and costs broken down by expense type.
(Click on image to enlarge)

Figure: 6 Monthly Receipts
The chart below shows how Medicare was a big driver of the larger deficit this year.
(Click on image to enlarge)

Figure: 7 Monthly Outlays
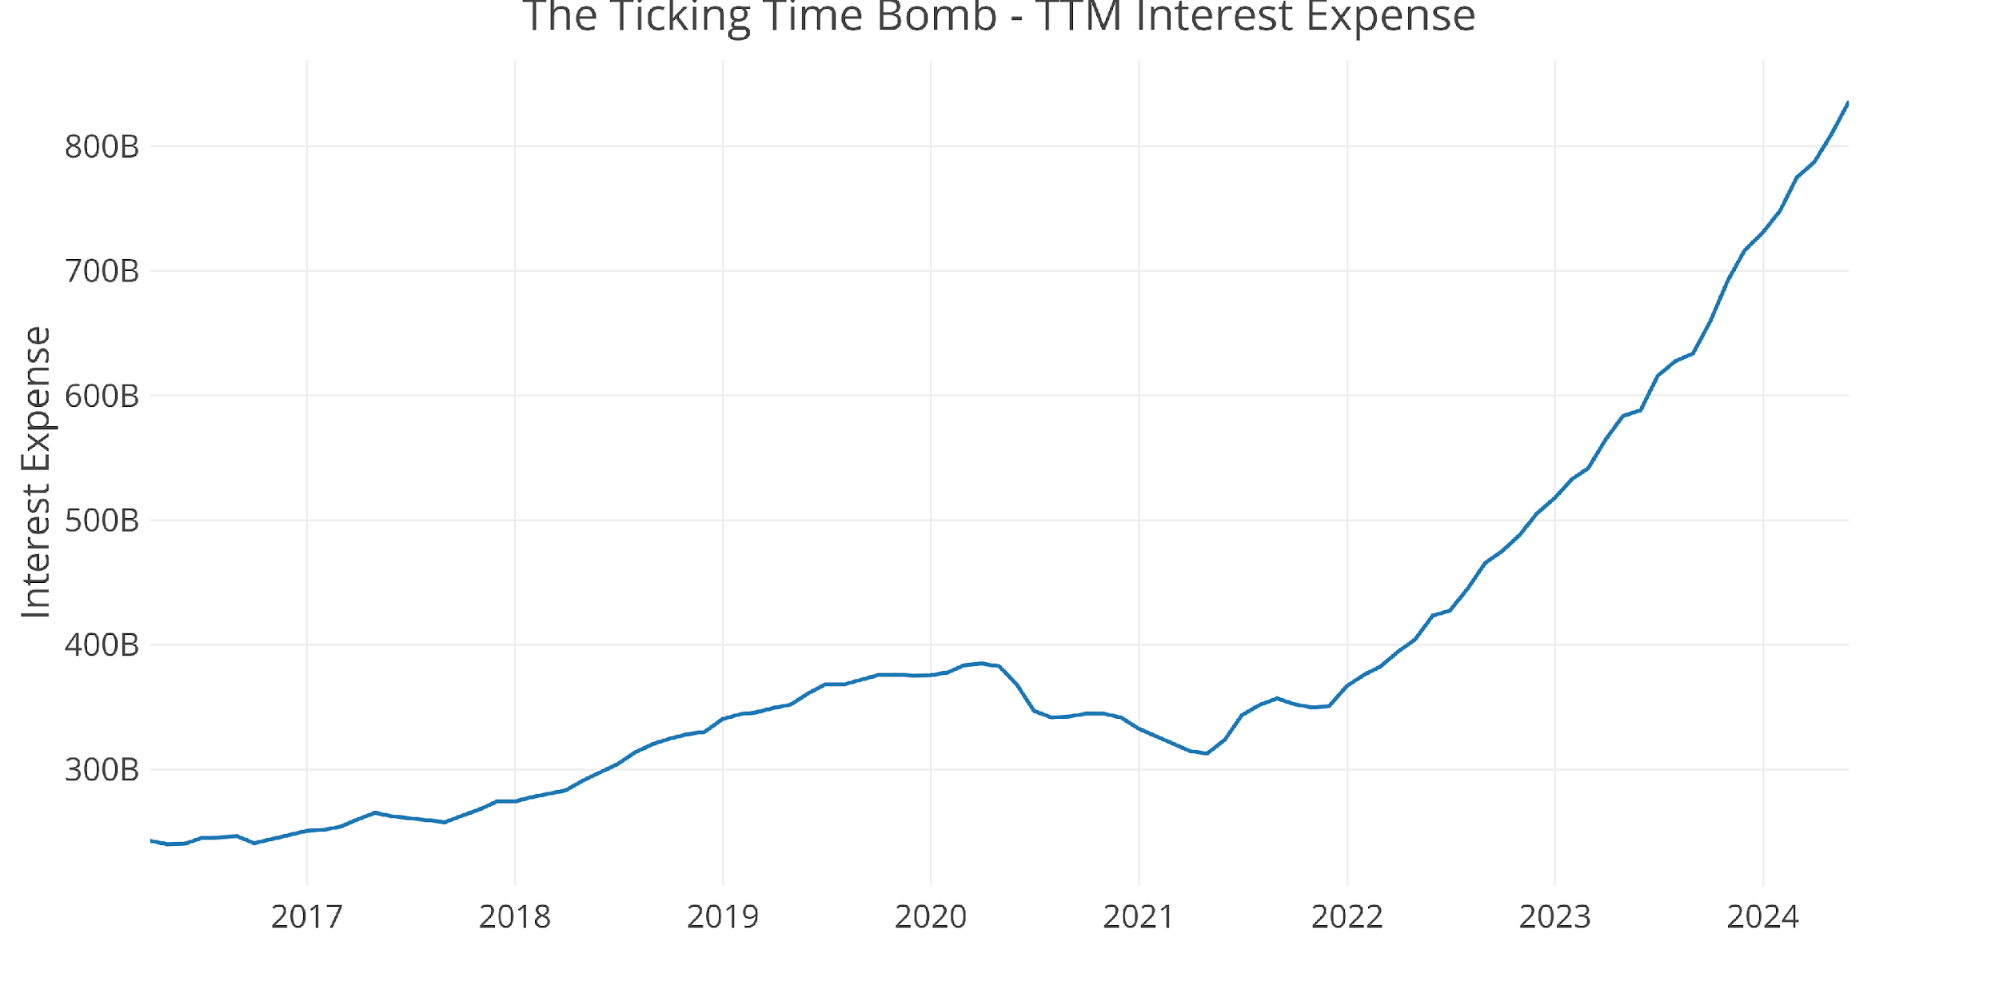
Interest Expense has ballooned higher to $836B.
(Click on image to enlarge)

Figure: 8 TTM Interest Expense
The table below goes deeper into the numbers of each category.
(Click on image to enlarge)

Figure: 9 US Budget Detail
Historical Perspective
Zooming out and looking over the history of the budget back to 1980 shows a complete picture. The change since COVID-19 is quite dramatic.
(Click on image to enlarge)

Figure: 10 Trailing 12 Months (TTM)
The next two charts zoom in on the recent periods to show the change when compared to pre-Covid. These charts show spending and revenue on a trailing 12-month basis period over period.
(Click on image to enlarge)

Figure: 11 Annual Federal Receipts
(Click on image to enlarge)

Figure: 12 Annual Federal Expenses
Data Source: Monthly Treasury Statement
Data Updated: Monthly on eighth business day
Last Updated: Period ending May 2024
US Debt interactive charts and graphs can always be found on the Exploring Finance dashboard: https://exploringfinance.shinyapps.io/USDebt/
More By This Author:
Chinese Central Bank Halts Gold AcquisitionsJobs: You Need To Look At The Household Survey
A Second Chance For Silver


