
Fed Rate Hike Prospects Focus The S&P 500 In Week 1 Of October 2017
The first week of October 2017 saw the S&P 500 (Index: INX) reach daily new highs each day through Thursday, before slightly dipping by 2.74 points (0.1%) to close the week at 2,549.33.
Since we had it set up to cover Week 1 of October 2017, let's take one last look at our chart showing the actual trajectory of the S&P 500 during 2017-Q3 against the backdrop of our alternative futures "spaghetti chart" forecasts that differ according to how our dividend futures-based model of how stock prices predict they would based on far forward in time investors are looking.
(Click on image to enlarge)
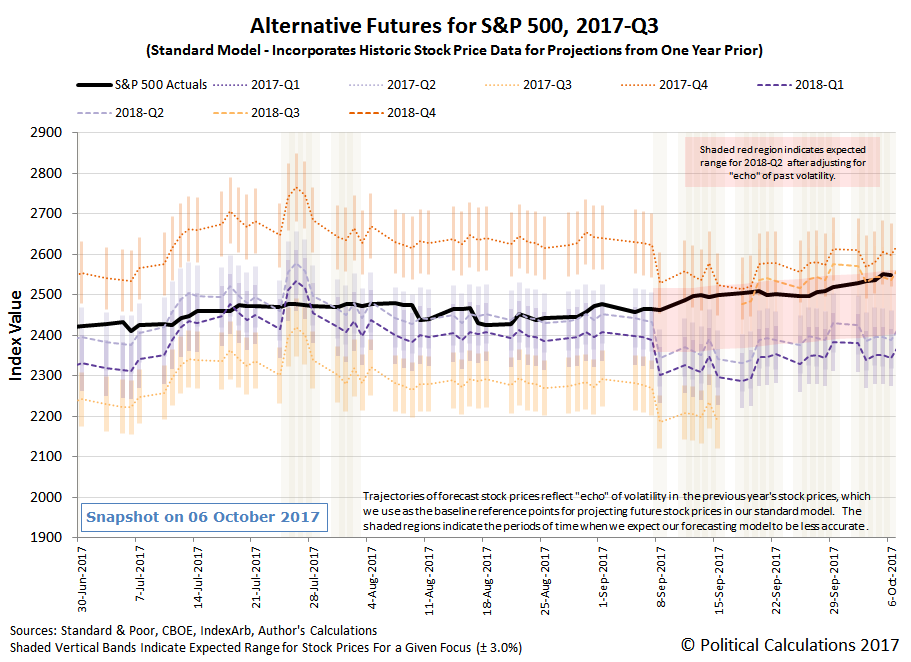
As best as we can tell, investors are still primarily focused on 2018-Q2, although with stock prices tracking along the upper edge of the echo-effect adjusted range indicated by the red zone shown on the chart, we believe that investors are also focusing on the current quarter of 2017-Q4.
The reason why we think that has a lot to do with the week's news events, where the expectations associated with future short term interest rate hikes by the U.S. Federal Reserve now suggest two rate hikes in the foreseeable future: one in 2017-Q4 and a second in 2018-Q2. The following table shows the CME Group's estimates of the probabilities htat the Federal Funds Rate will be set as indicated at various future meetings of the Federal Reserve's Open Market Committee (FOMC):
| Probabilities for Target Federal Funds Rate at Selected Upcoming Fed Meeting Dates (CME FedWatch on 15 September 2017) | ||||||
|---|---|---|---|---|---|---|
| FOMC Meeting Date | Current | |||||
| 75-100 bps | 100-125 bps | 125-150 bps | 150-175 bps | 175-200 bps | 200-225 bps | |
| 13-Dec-2017 (2017-Q4) |
0.0% | 9.4% | 89.2% | 1.4% | 0.0% | 0.0% |
| 12-Mar-2018 (2018-Q1) |
0.0% | 5.8% | 58.3% | 34.4% | 1.5% | 0.0% |
| 13-Jun-2018 (2018-Q2) |
0.0% | 3.5% | 37.2% | 43.1% | 15.1% | 1.1% |
| 26-Sep-2018 (2018-Q3) |
0.0% | 2.3% | 26.2% | 41.0% | 24.2% | 5.8% |
And since we're in the business of looking forward, the following chart updates our alternaive futures chart to peer through the end of the fourth quarter of 2017.
(Click on image to enlarge)

The headlines of the week reinforce the apparent influence of the expectations of future Fed rate hikes on investor expectations.
Monday, 2 October 2017
- Oil falls more than two percent on signs of higher output
- Fed's Kaplan says will need to 'look hard' at December rate hike
- Fed's rate hikes causing low inflation, Kashkari says
- Wall Street starts quarter higher; data signals strength
Tuesday, 3 October 2017
- Oil dips over doubts recent rally will last through forth quarter
- Major indexes hit record highs second day; autos, airlines jump
Wednesday, 4 October 2017
- Oil slips after surprising increase in U.S. crude exports
- Wall St. extends run of record highs; services data upbeat
Thursday, 5 October 2017
- Fed's Harker sees three rate hikes next year, after one more in 2017
- Williams: Don't need to see inflation move to continue rate hikes
- U.S. Fed buys $7 billion of mortgage bonds, sells none
- Fed's George says further U.S. rate hikes are needed
- Oil rises 2 percent, boosted by potential OPEC deal
- S&P 500 sets sixth record high close on tax overhaul optimism
Friday, 6 October 2017
- Oil down 2 percent, breaks five-week rally as oversupply fears resurface
- Downplaying job losses, Fed officials eye December rate hike
- U.S. September jobs data raise U.S. December rate-hike bets
- Fed's Dudley expects rate hikes; unmoved by inflation, storm effects
- Fed's Bullard concerned 'policy mistake' could hamper Fed goals
- Fed's Kaplan says inflation pressures likely building
- Fed's Bostic sees another U.S. interest rate hike in 2017
- Fed must hike rates in face of hot U.S. labor market: Rosengren
- S&P 500 breaks record run on jobs data, drug chain drop
But wait, that's not all that happened during the first week of October 2017!
Disclosure: None.


