
Fade The Fame & Short Nvidia…
Conventional thinking, particularly around important turning points, is usually not very helpful because it tends to focus on the extrapolation of past trends into the future. ~ Tony Boeckh

In this week’s Dirty Dozen [CHART PACK] we cover the developing buy setup in the SPX along with a buy setup in crude and a major sell setup in NVDA, plus more…
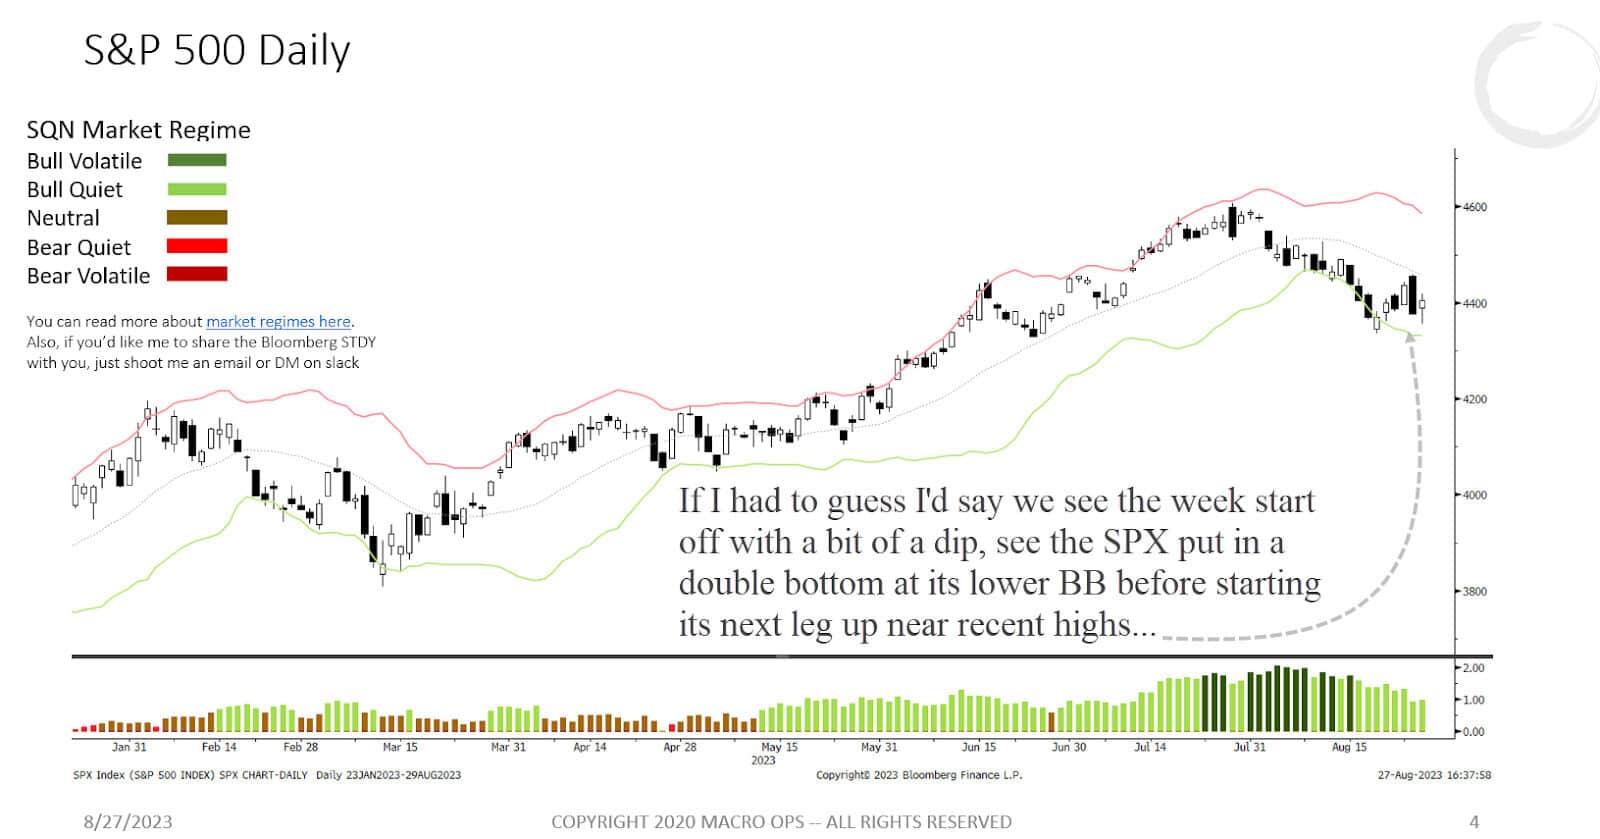
1. Last week I said to look for a double bottom before this retrace is over. It looks like we’re seeing one form now. This might be all we get or maybe we see one more dip to the lower band before this selloff is over.
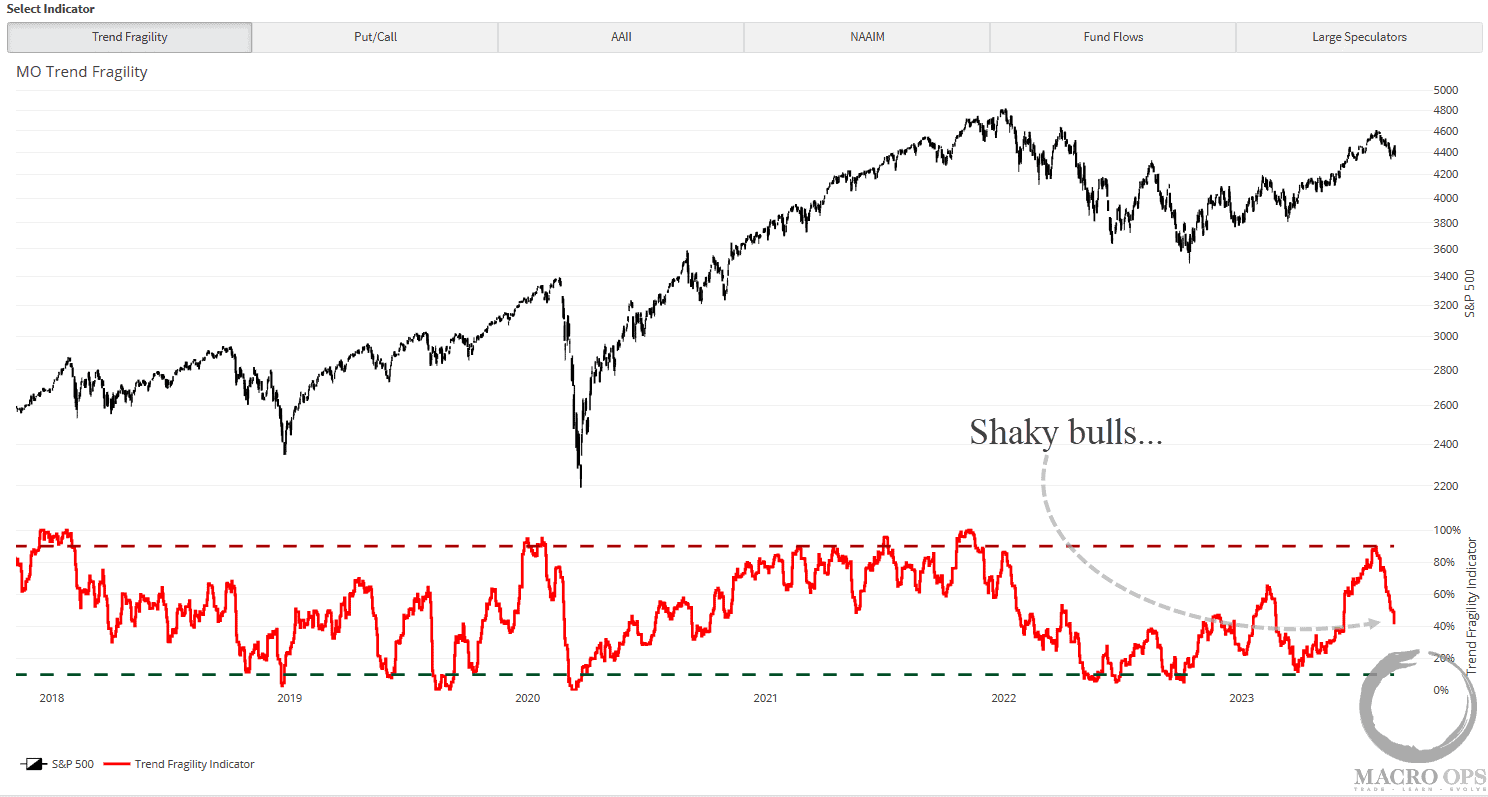
2. Our Trend Fragility indicator triggered a proper >90% sell signal two weeks ago, which ended up marking the highs of this move. Since then it’s come down incredibly fast and now sits at a neutral 40%, which is unusual considering how vanilla this retrace has been.
While I’m much less bullish the market now than I was just a few months ago, this type of sharp bearish reaction function tells me the crowd is still pretty fearful and that’s a contextual bullish input.
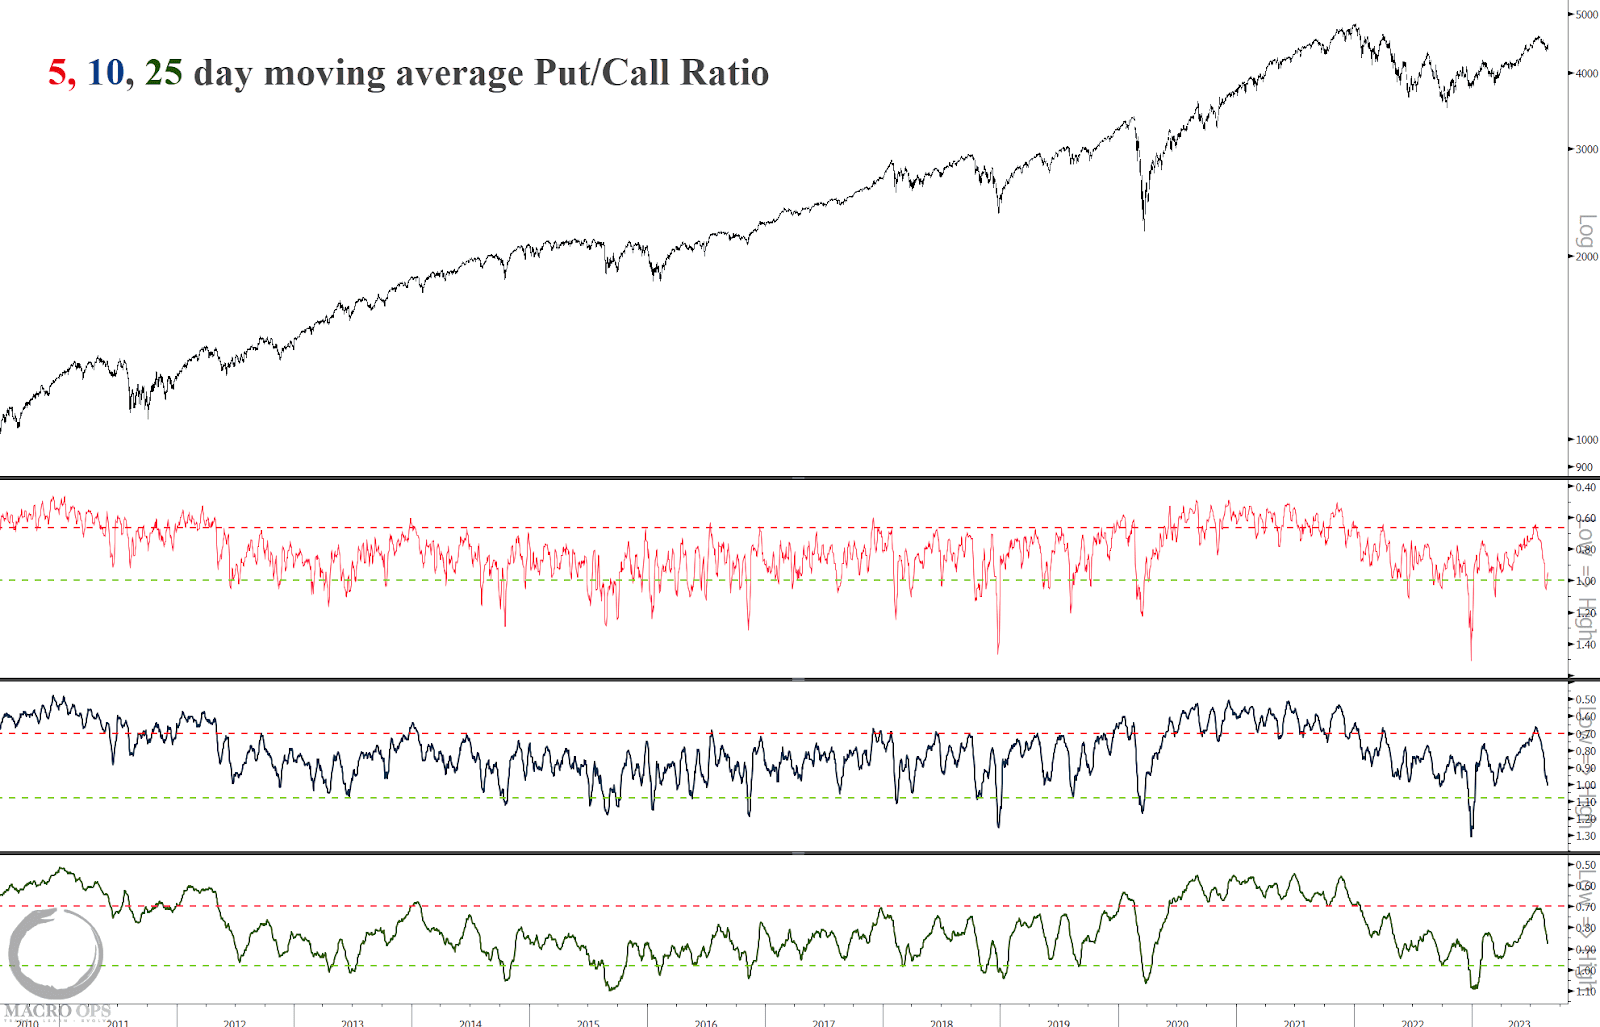
3. We can see similar action in the Put/Call numbers. Below are the 5,10, and 25dmas for the Total Put/Call ratio. Two weeks ago they each gave a sell signal. And already, the 5 and nearly the 10dma are triggering buys.
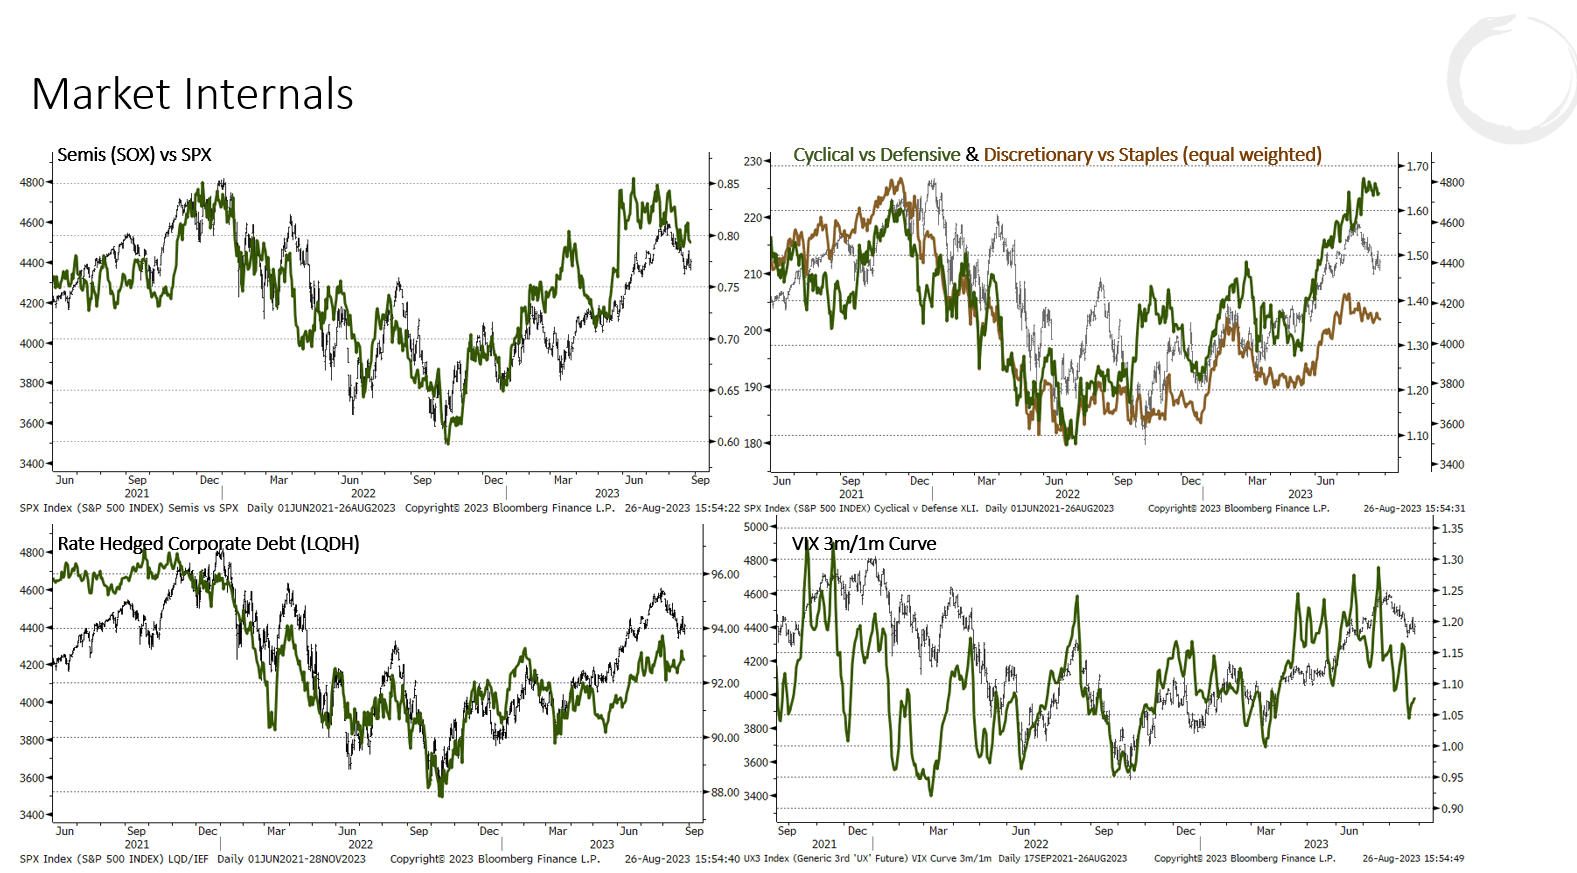
4. And we’re still not seeing the negative divergences that precede or coincide with major topping processes. Quite the opposite with Cyclical vs. Defensive leading the way higher.
5. Three weeks ago I pointed out the stretched technicals in crude and said to be on the lookout for a multiweek pullback. I argued that this pullback should be viewed as a retrace within a larger uptrend as the 7-bar consecutive bull thrust that preceded this move means we should expect another leg higher.
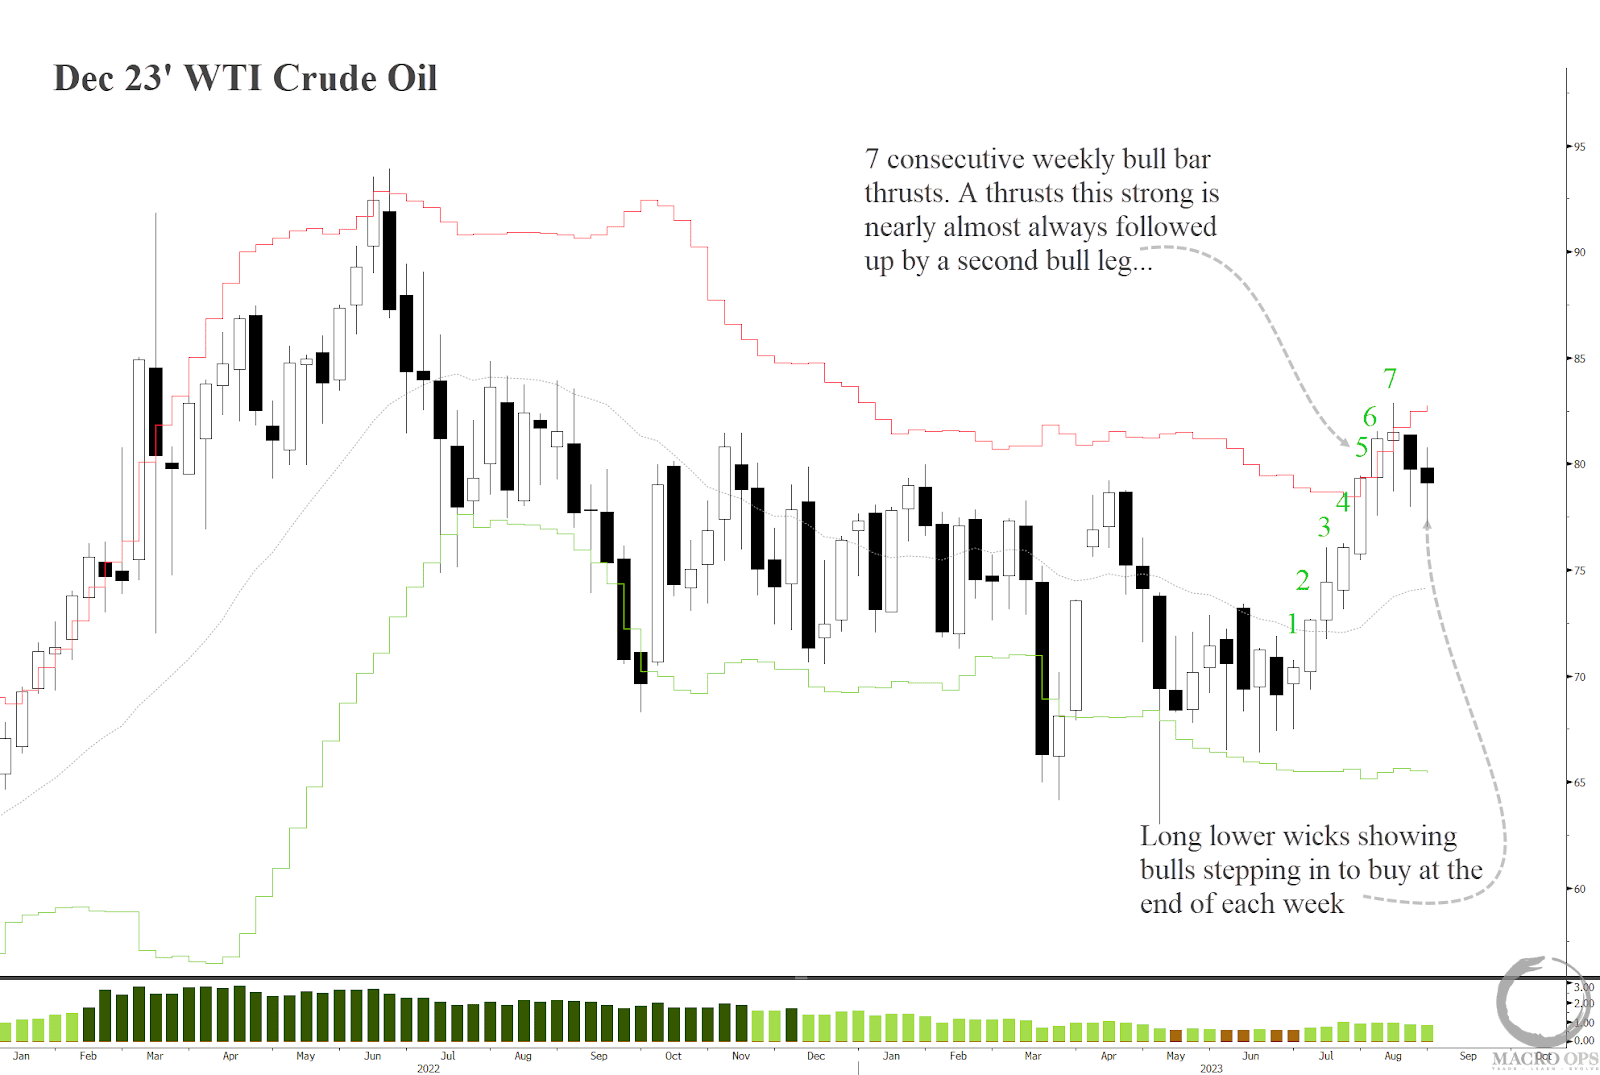
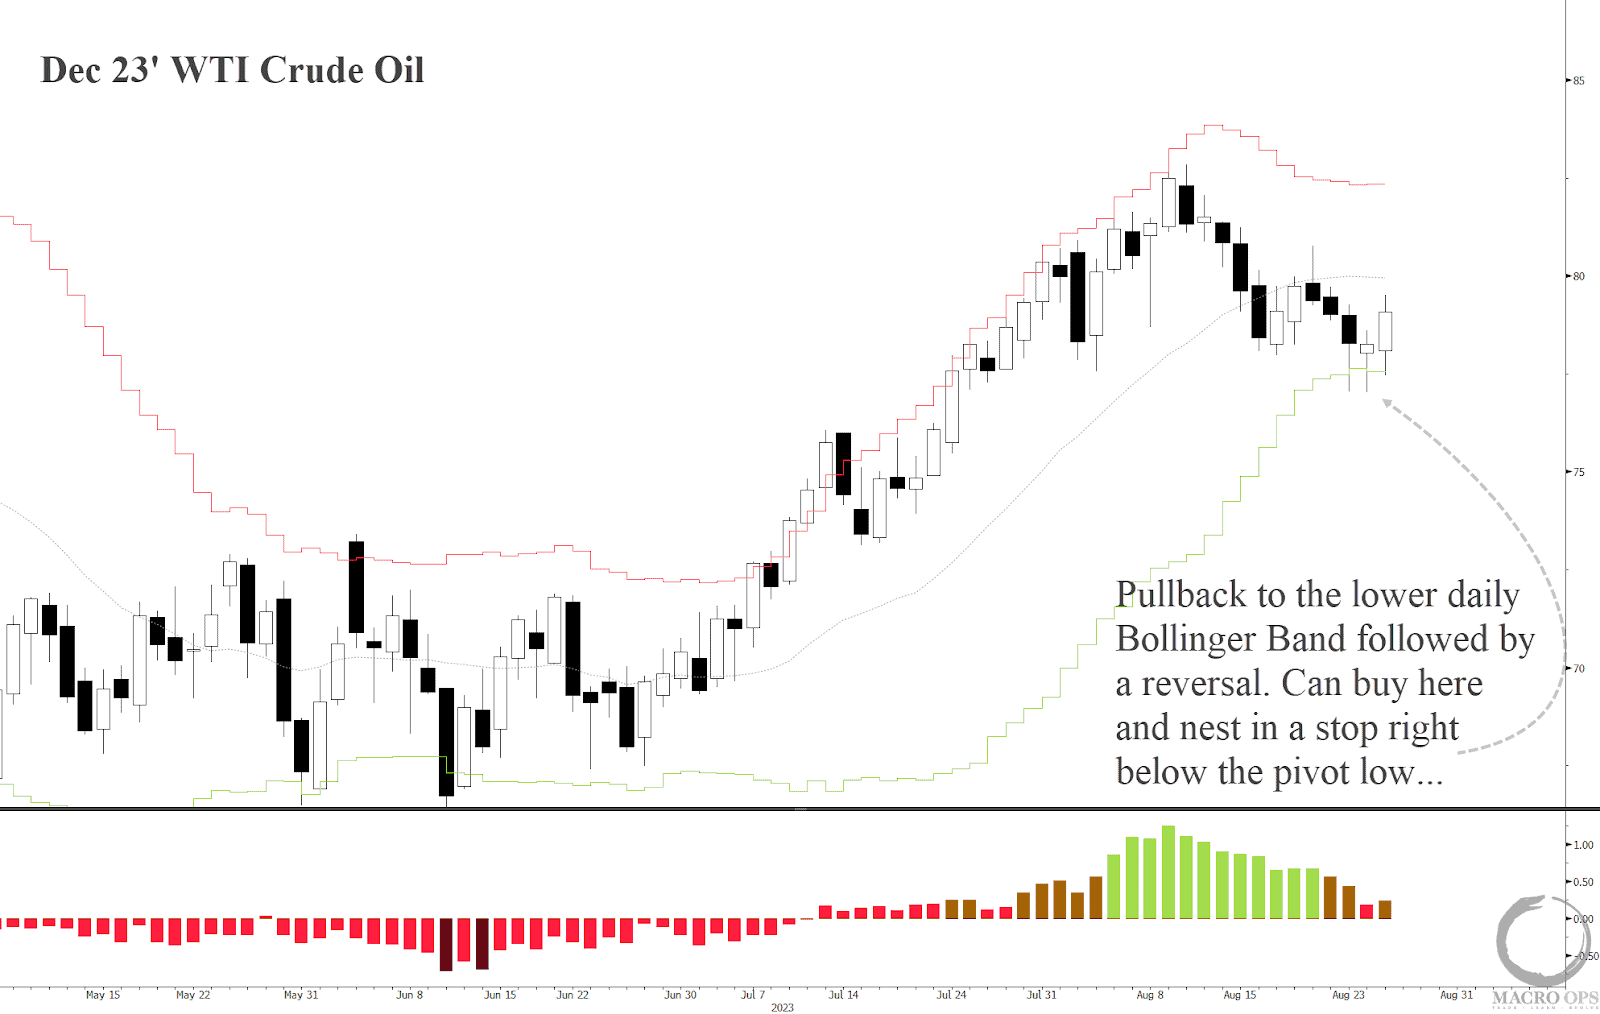
6. The current level with the price trading at its lower daily band gives us a good technical inflection point in order to nest in a stop and get some size on with little risk.
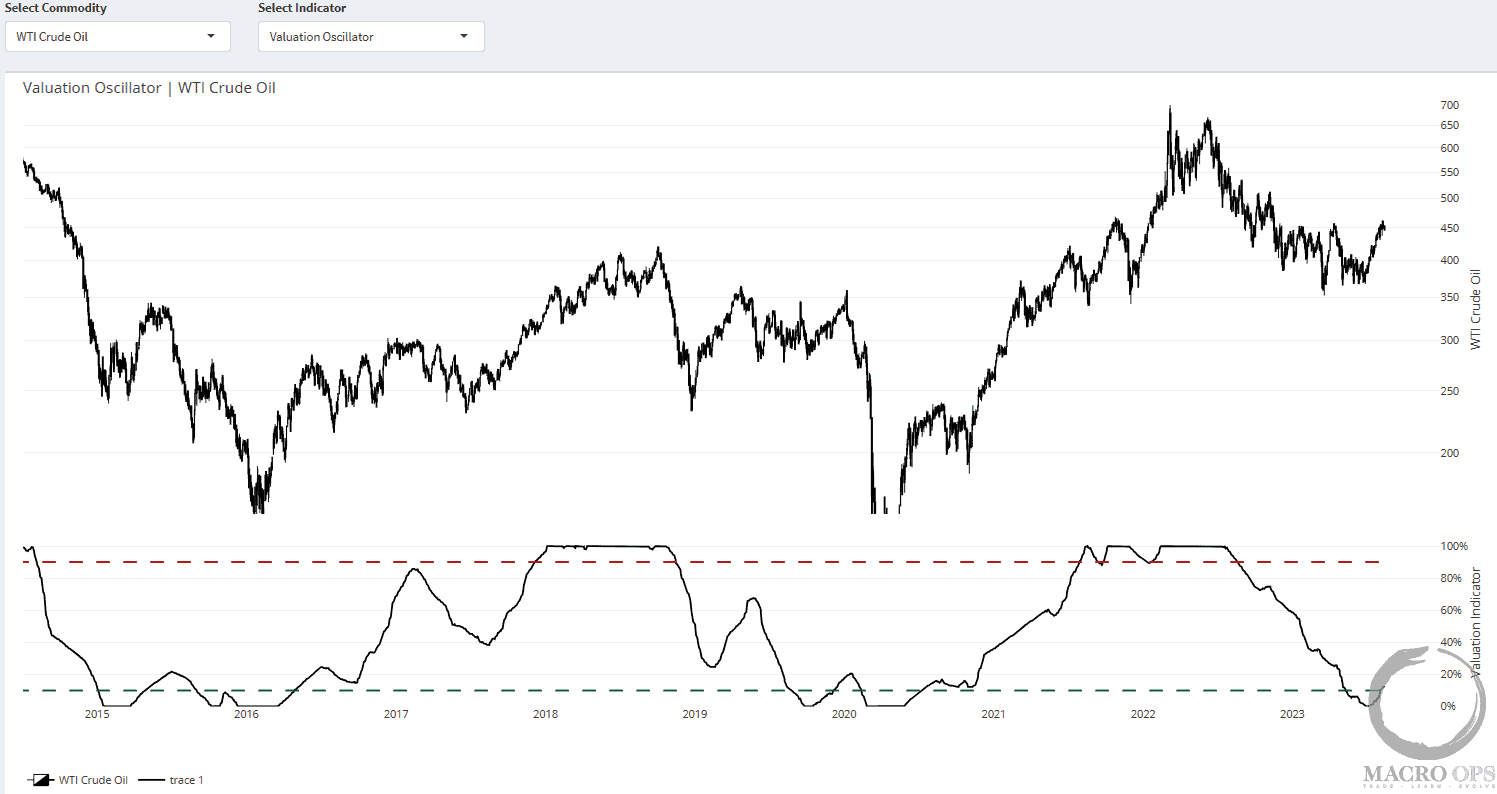
7. Our long-term valuation oscillator shows that crude is trading in the sub-10th percentile of its historical valuation. This is a good long-term signal, especially when it comes with crude in a broader uptrend like it is now.
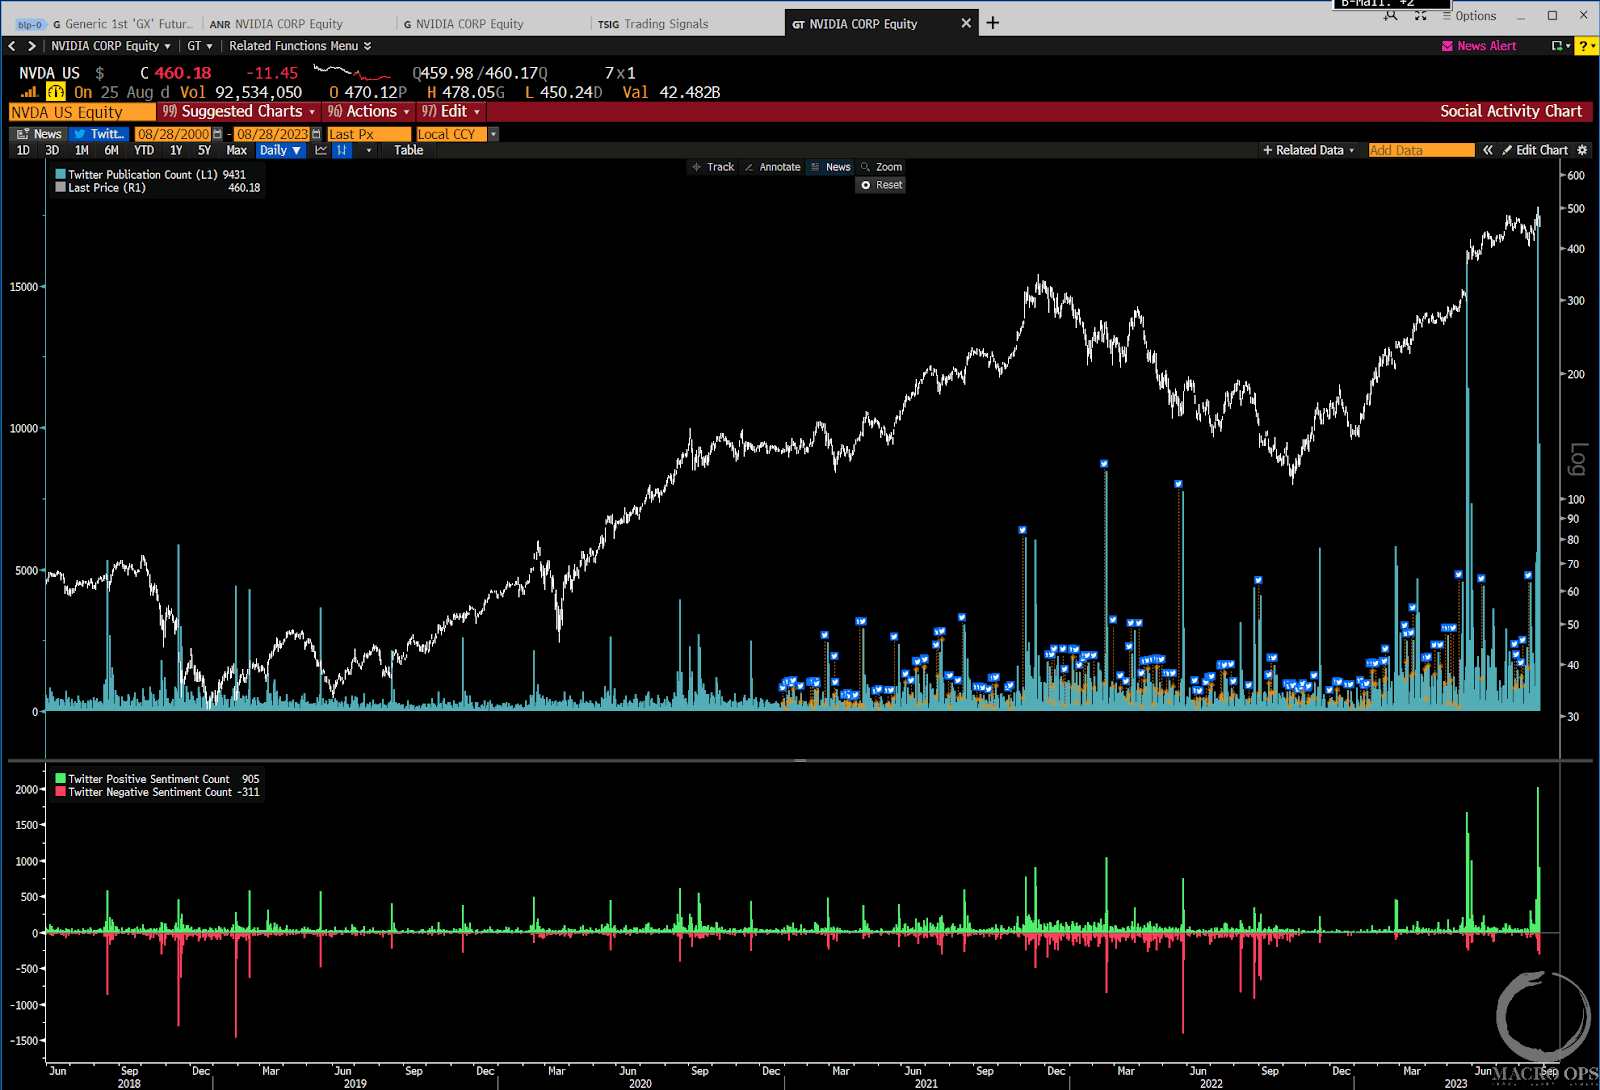
8. Here are the top article titles that pop up when I type NVDA into my BBG: “Nvidia price target raised to $600 from $575 at Susquehanna… Nvidia Touches Record High On AI-fueled Earnings Beat… Why Nvidia’s AI bonanza may have only just begun…Nvidia Stock Could Climb Another 30%, Piper Sandler Says…Heard on the Street: Nvidia’s AI Surge Is Just Getting Started…”
The bottom two charts show the news publication count and positive to negative news spread, as well as the Twitter count and positive/negative spread, are at bullish records for NVDA…
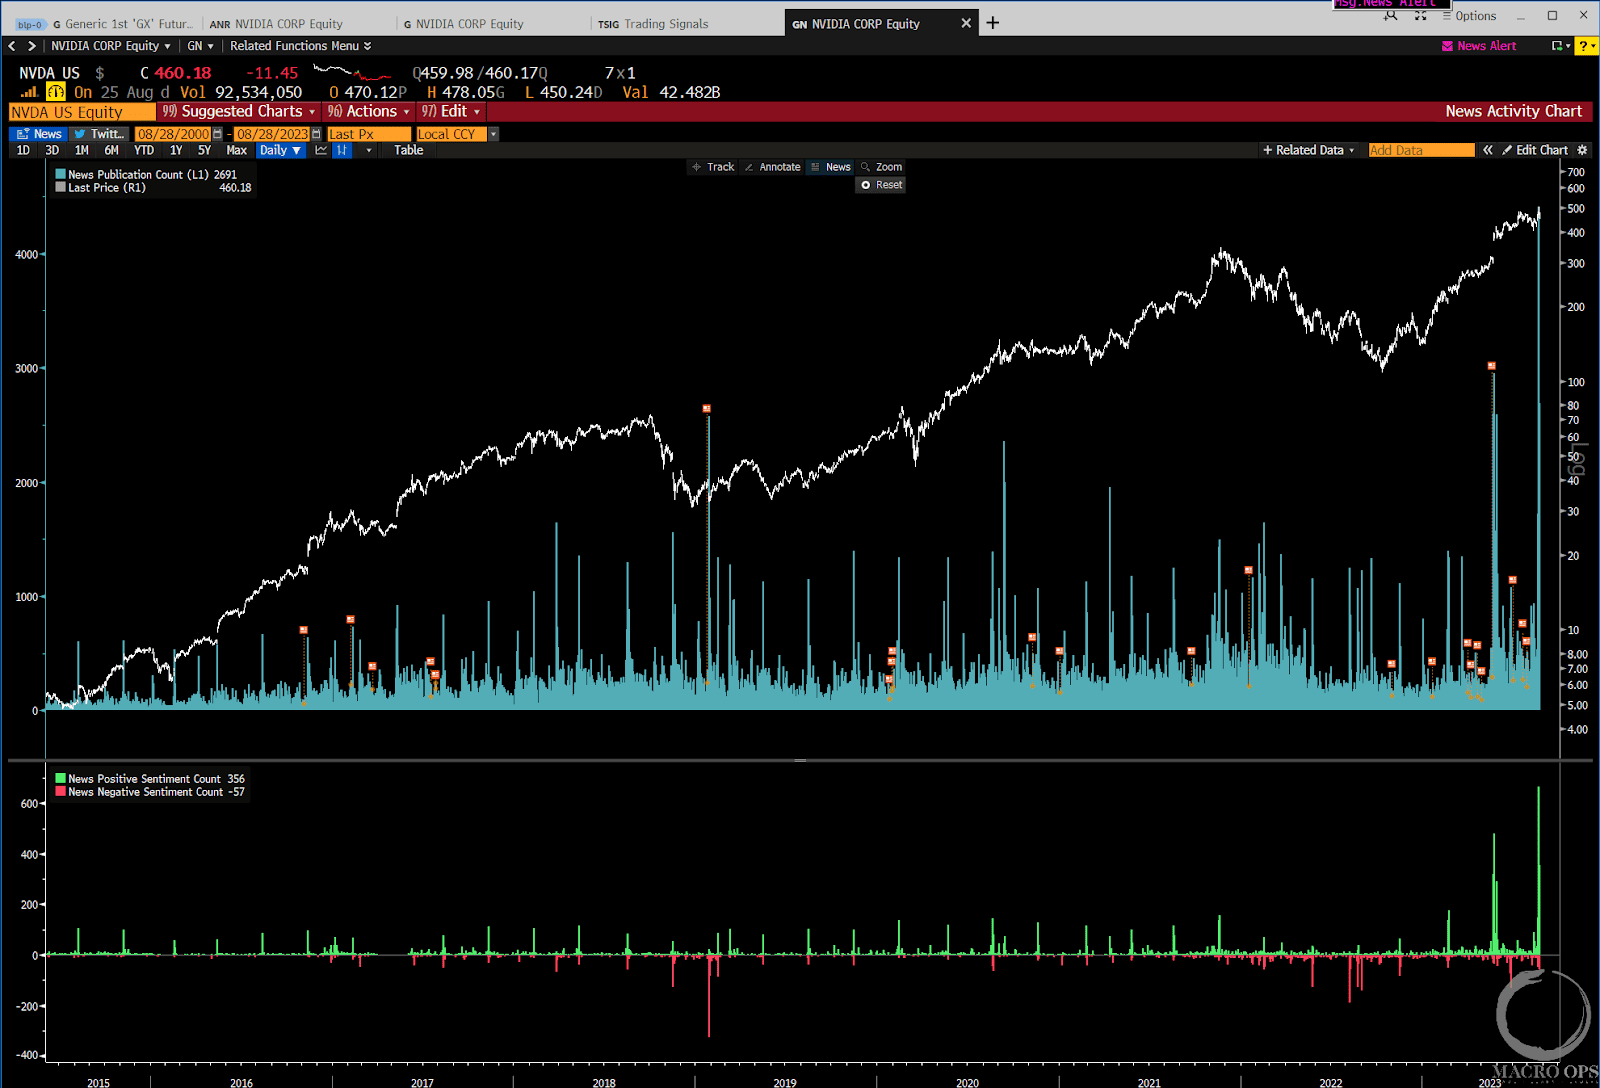
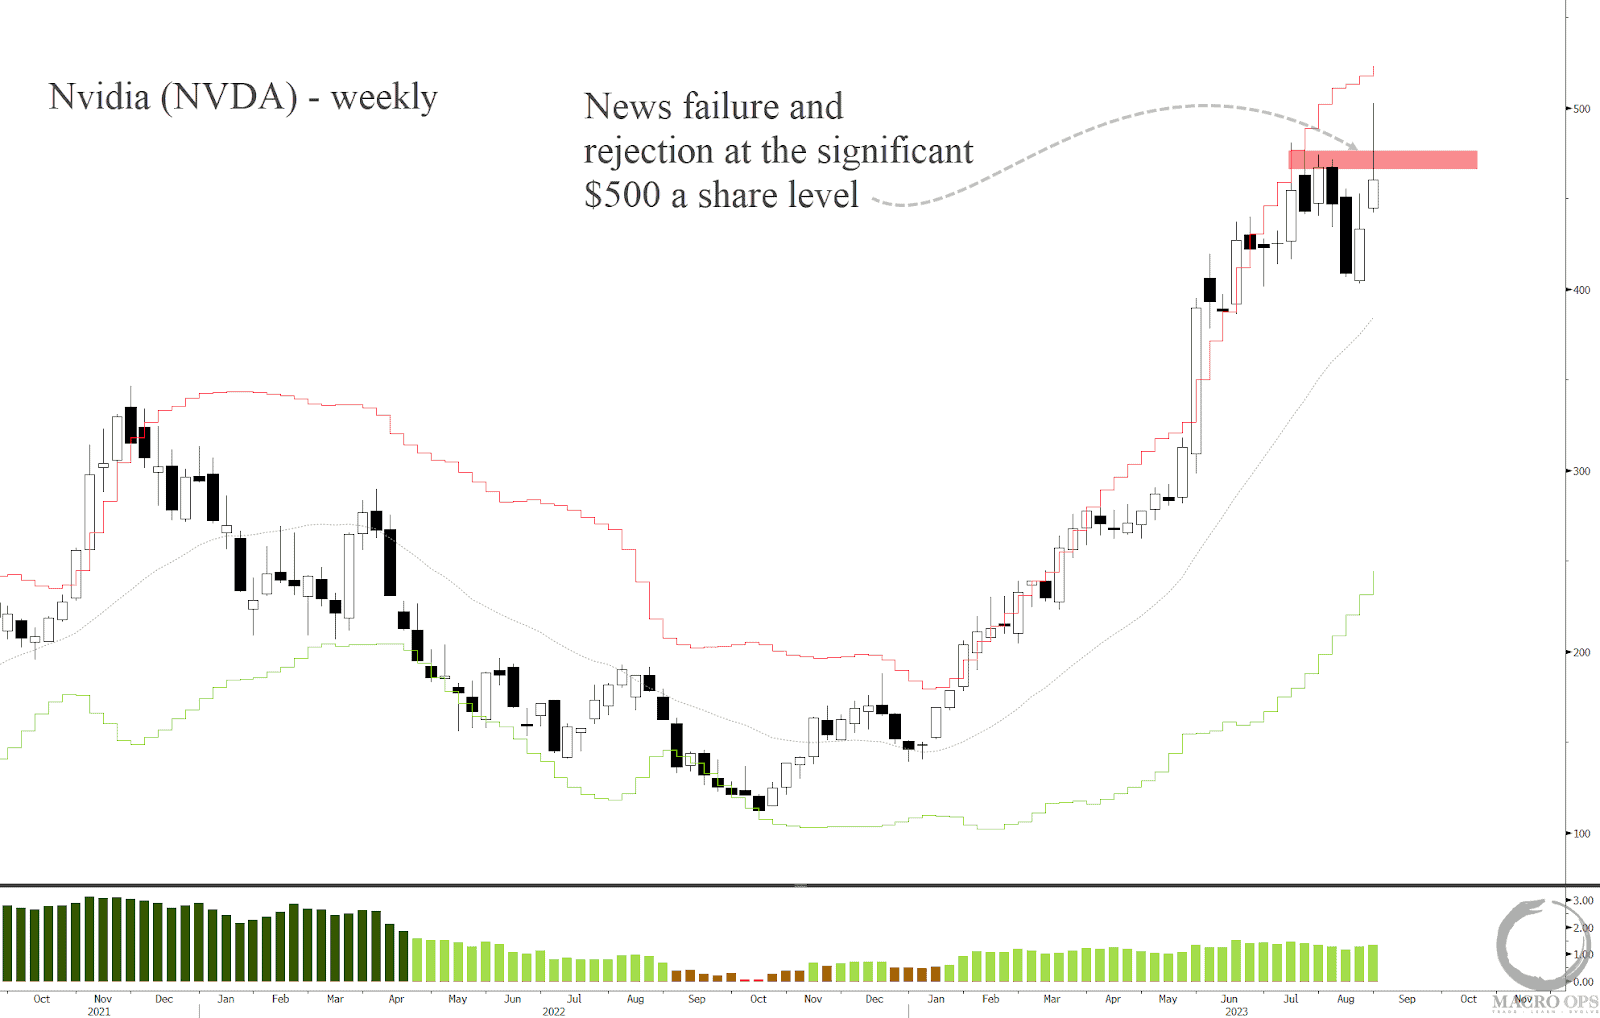
9. Despite this record fanfare following a “mindblowing” earnings report, the stock faded all of its post-earnings gains, closing the week with a giant upper wick.
This is what a news failure looks like. It happened at the significant $500 level. We’ll be watching this name for a short. A daily close above the $500 level would negate the news failure along with the short setup.
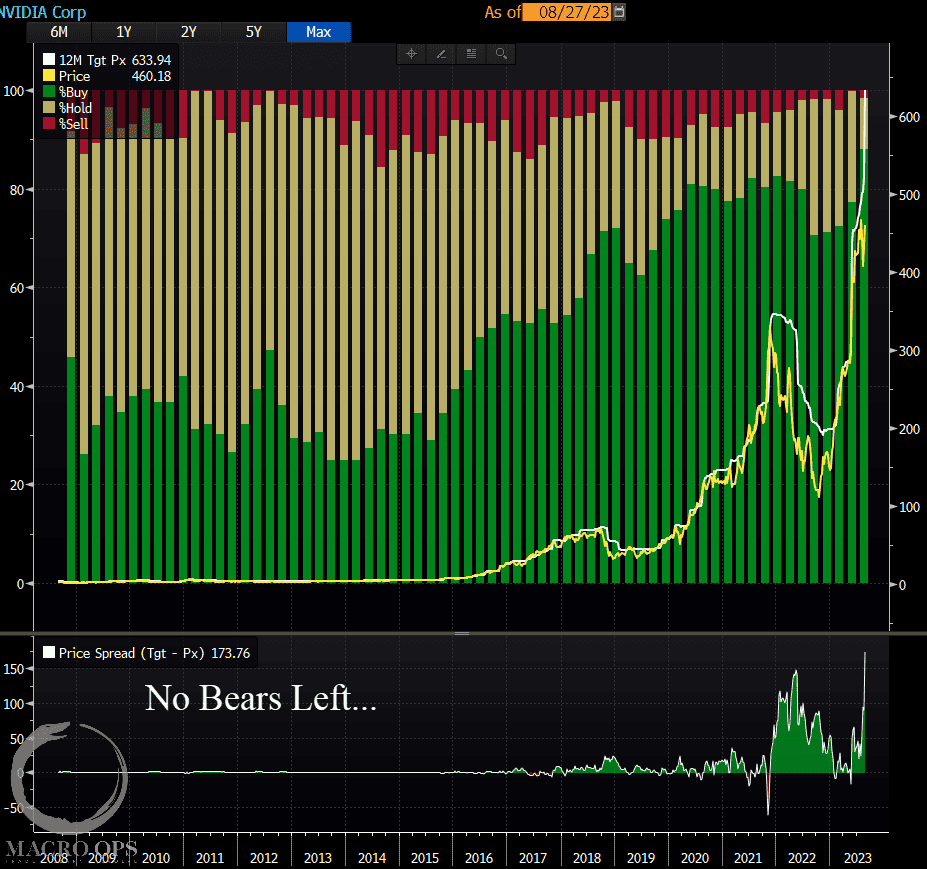
10. What consensus looks like…. Analyst Buy ratings at all-time highs.
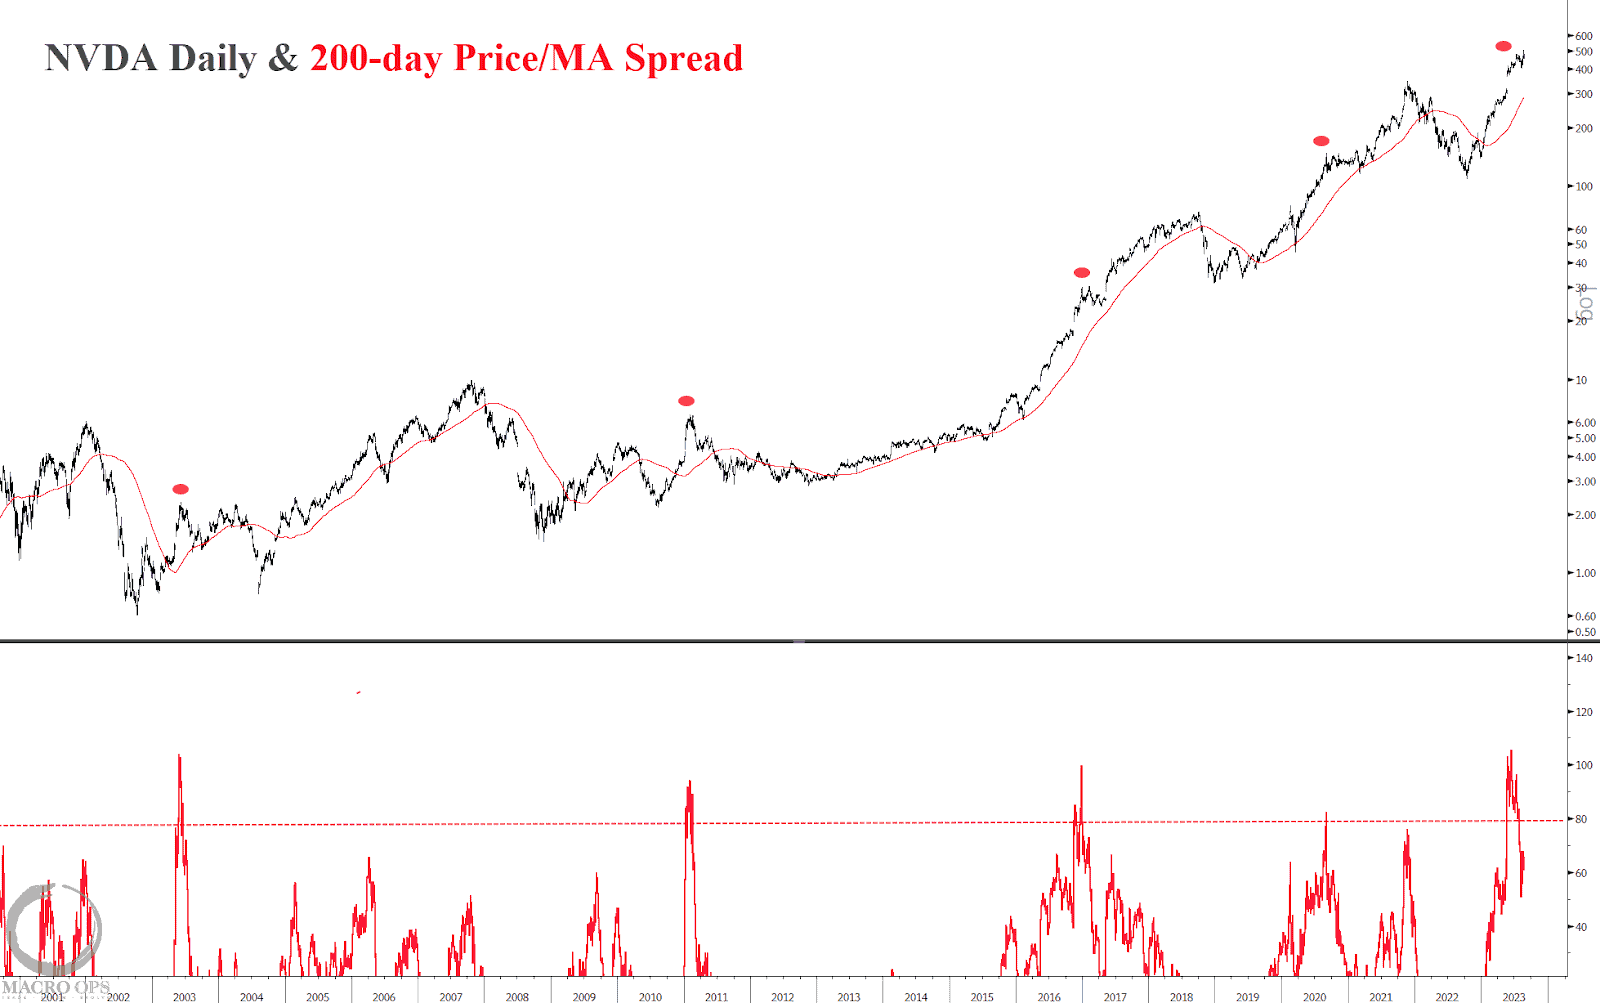
11. The stock jumped over 100% above its 200dma this past week and regardless of whether a major top is in it’s likely we see the forces of mean reversion weigh on the stock in the interim.
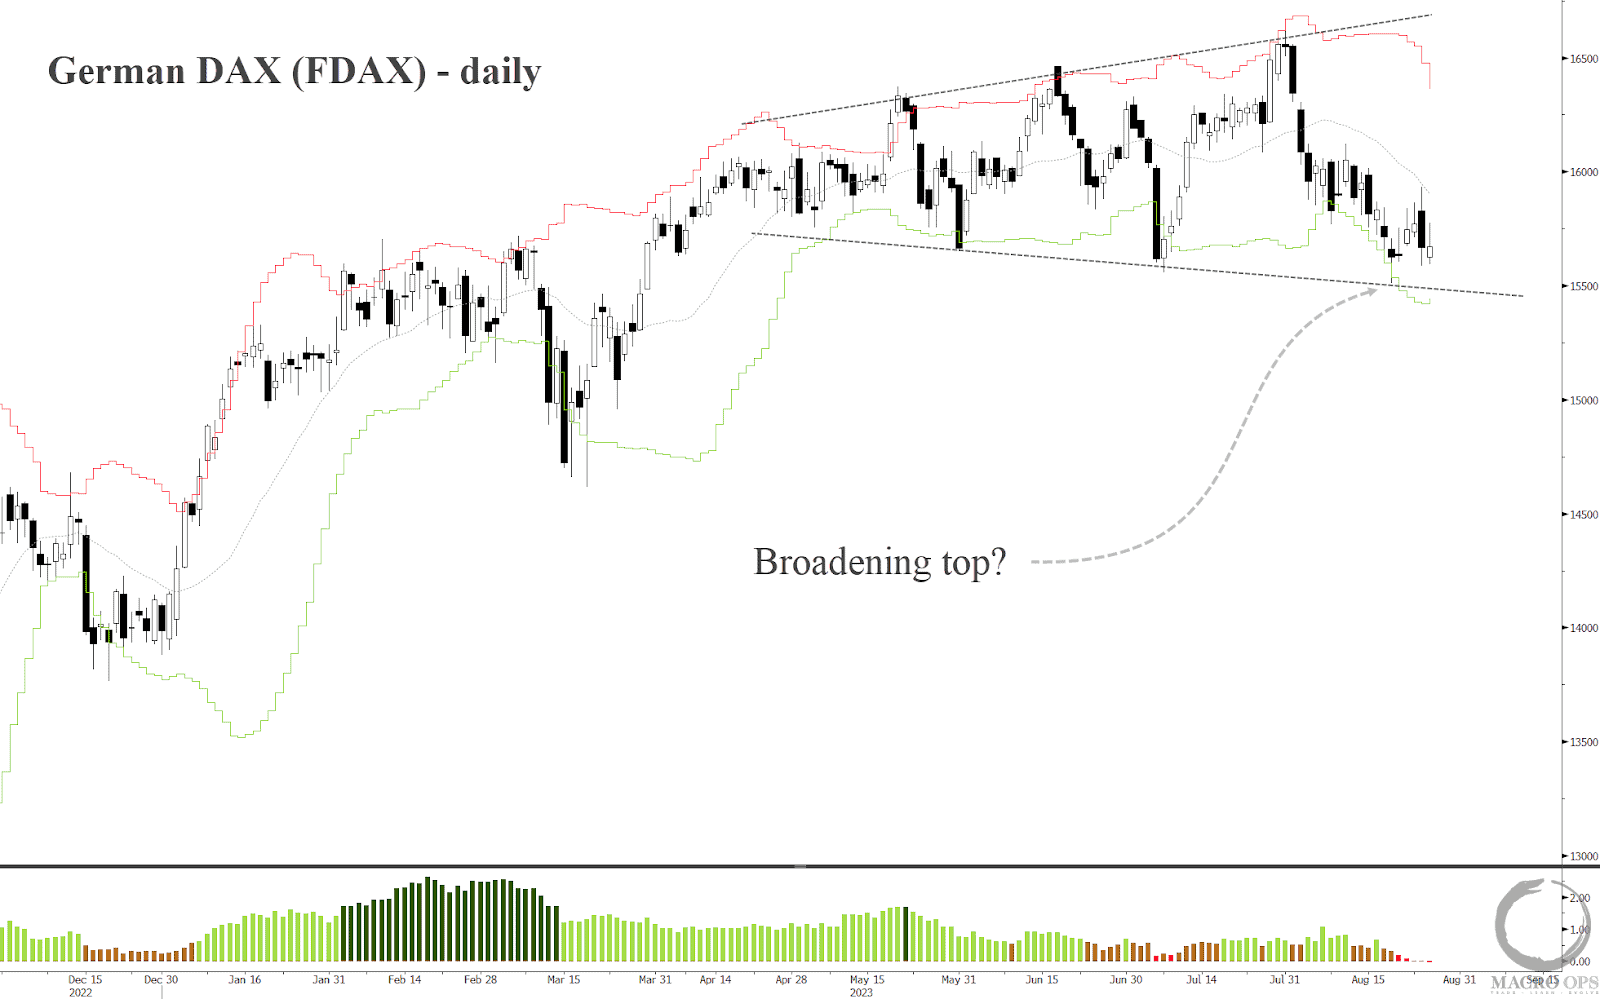
12. If you wanted to short an index then I’d look to the German DAX which looks to be forming a large broadening top. Also, it’s very likely the German economy slips into a recession within the next few months.
Thanks for reading.
More By This Author:
The Whales Bail On Nvidia
A Bear Trap In Bonds…
A Sign Of Increasing Volatility…
Disclaimer: All statements are solely opinions and are for educational purposes only.


