
EUR/USD Weekly Forecast: Dollar Slips As September Cut Odds Rise

Image Source: Unsplash
The EUR/USD currency pair's weekly forecast points to a higher likelihood of a September Fed rate cut. The potential of such a scenario has been weighing on the dollar in recent trading.
The Ups and Downs of the EUR/USD Pair
The EUR/USD pair witnessed a rather bullish week as the dollar fell amid an increase in Fed rate cut expectations. Rate cut bets rose during the week, as the latest data revealed soft inflation and poor consumer spending.
The US CPI increased by 2.7% annually, compared to the forecast of 2.8%. The report had a huge impact since it came after the poor employment figures seen in the previous week. At the same time, retail sales came in below estimates, indicating weaker consumer spending.
However, wholesale inflation was much hotter than expected in July, dashing hopes for a massive cut in September. Still, traders have been almost fully pricing in a 25 bps rate cut.
Next Week’s Key events for the EUR/USD Pair
Next week, traders will likely focus on the FOMC meeting minutes and the Jackson Hole Symposium. The minutes will illustrate the tone of the last meeting. Moreover, it might contain clues on future policy moves.
At the same time, Powell will likely speak at the symposium. Traders will likely wait to see whether his tone has become more dovish after the latest set of economic data. It should be noted that the labor market has slowed down significantly, and inflation has been softer.
EUR/USD Weekly Technical Forecast: Bulls Return after Morning Star Pattern
(Click on image to enlarge)
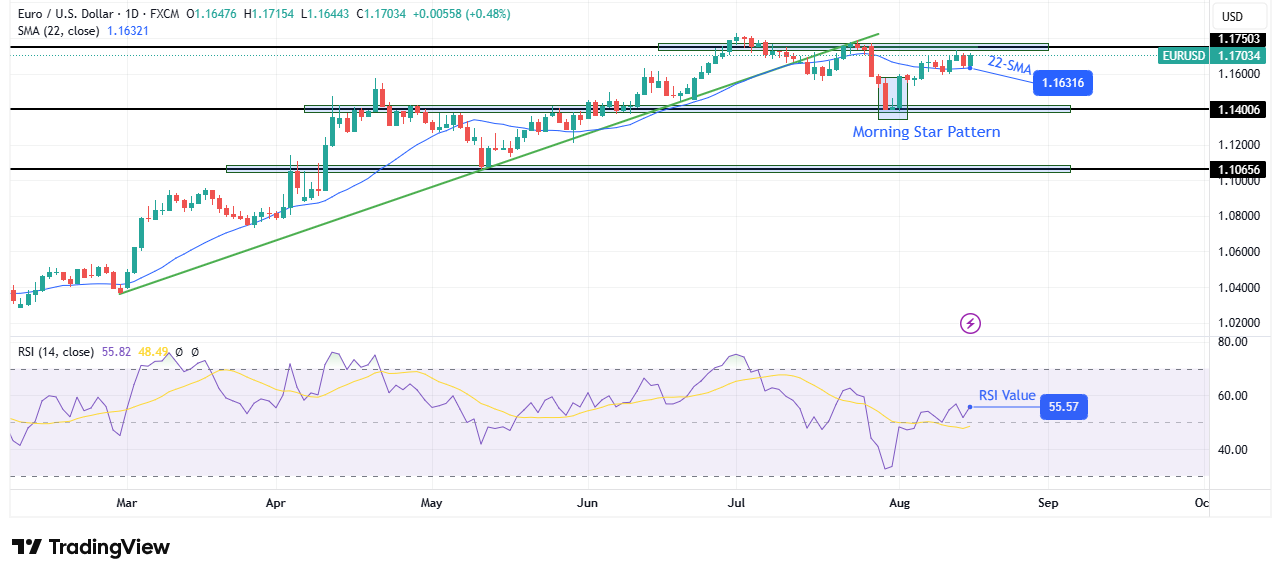
EUR/USD daily chart
On the technical side, the EUR/USD pair's price has recently been trading above the 22-SMA, with the RSI reaching over 50, which may sugges a bullish bias. Moreover, the price appears ready to retest the 1.1750 key resistance level. A break above would strengthen the bullish bias and continue the previous uptrend. On the other hand, if the resistance level holds firm, the price could bounce lower to start a downtrend.
Bears recently broke out of a major trendline that had defined the recent rally. However, the decline could not go past the 1.1400 support level. Instead, the price made a morning star pattern, indicating a likely bullish reversal. Soon after, bulls took charge by pushing the price above the 22-SMA.
The bullish reversal pattern is potentially a sign that bulls have regained momentum after a deep pullback. Therefore, this may increase the chance that the price could break above the 1.1750 resistance level to continue the uptrend.
More By This Author:
USD/CAD Weekly Forecast: Trade Barriers Undermine Canadian Dollar
AUD/USD Forecast: Breather For RBA Amid Upbeat Jobs
GBP/USD Price Analysis: Sep Cut On The Table As US Inflation Cools
Disclaimer: Foreign exchange (Forex) trading carries a high level of risk and may not be suitable for all investors. The risk grows as the leverage is higher. Investment objectives, risk ...
more

