EUR/USD Recovers On Weaker US Services PMIs
EUR/USD is rebounding and trading back above 1.0800 on Thursday, following the release of lower-than-expected ISM Services PMI data from the US.
The data increases the probability of the Federal Reserve (Fed) cutting interest rates by June, bringing it more in line with the more concrete expectations of when the European Central Bank (ECB) will start cutting rates.
The US Dollar (USD) suffered after the release because relatively lower interest rates or their expectation thereof are usually negative for a currency since they reduce inflows of foreign capital.
EUR/USD: Services inflation not so sticky
EUR/USD rebounded strongly on Wednesday after the release of ISM Services PMI for March undershot expectations. But it was probably the sharper fall in the ISM Services Prices Paid component figure, which measures inflation in the sector, which was the main driver of USD weakness.
Services inflation is considered stickier than other types of inflation and is one of the metrics being most closely watched by the Fed as they try to decide when or whether to cut interest rates.
(Click on image to enlarge)
ISM Services Prices Paid: Monthly
The fall in Prices Paid to 53.4 from 58.6 prior, is a sign inflation in the sector is cooling considerably, making it more likely the Fed will cut interest rates by June.
Indeed, this was reflected by the CME FedWatch tool, which gives a market-based probability of future Fed decisions, which is now indicating an over-60% chance of a cut by June, from a probability in the mid-50% range on Monday.
Technical Analysis: EUR/USD threatening to reverse short-term downtrend
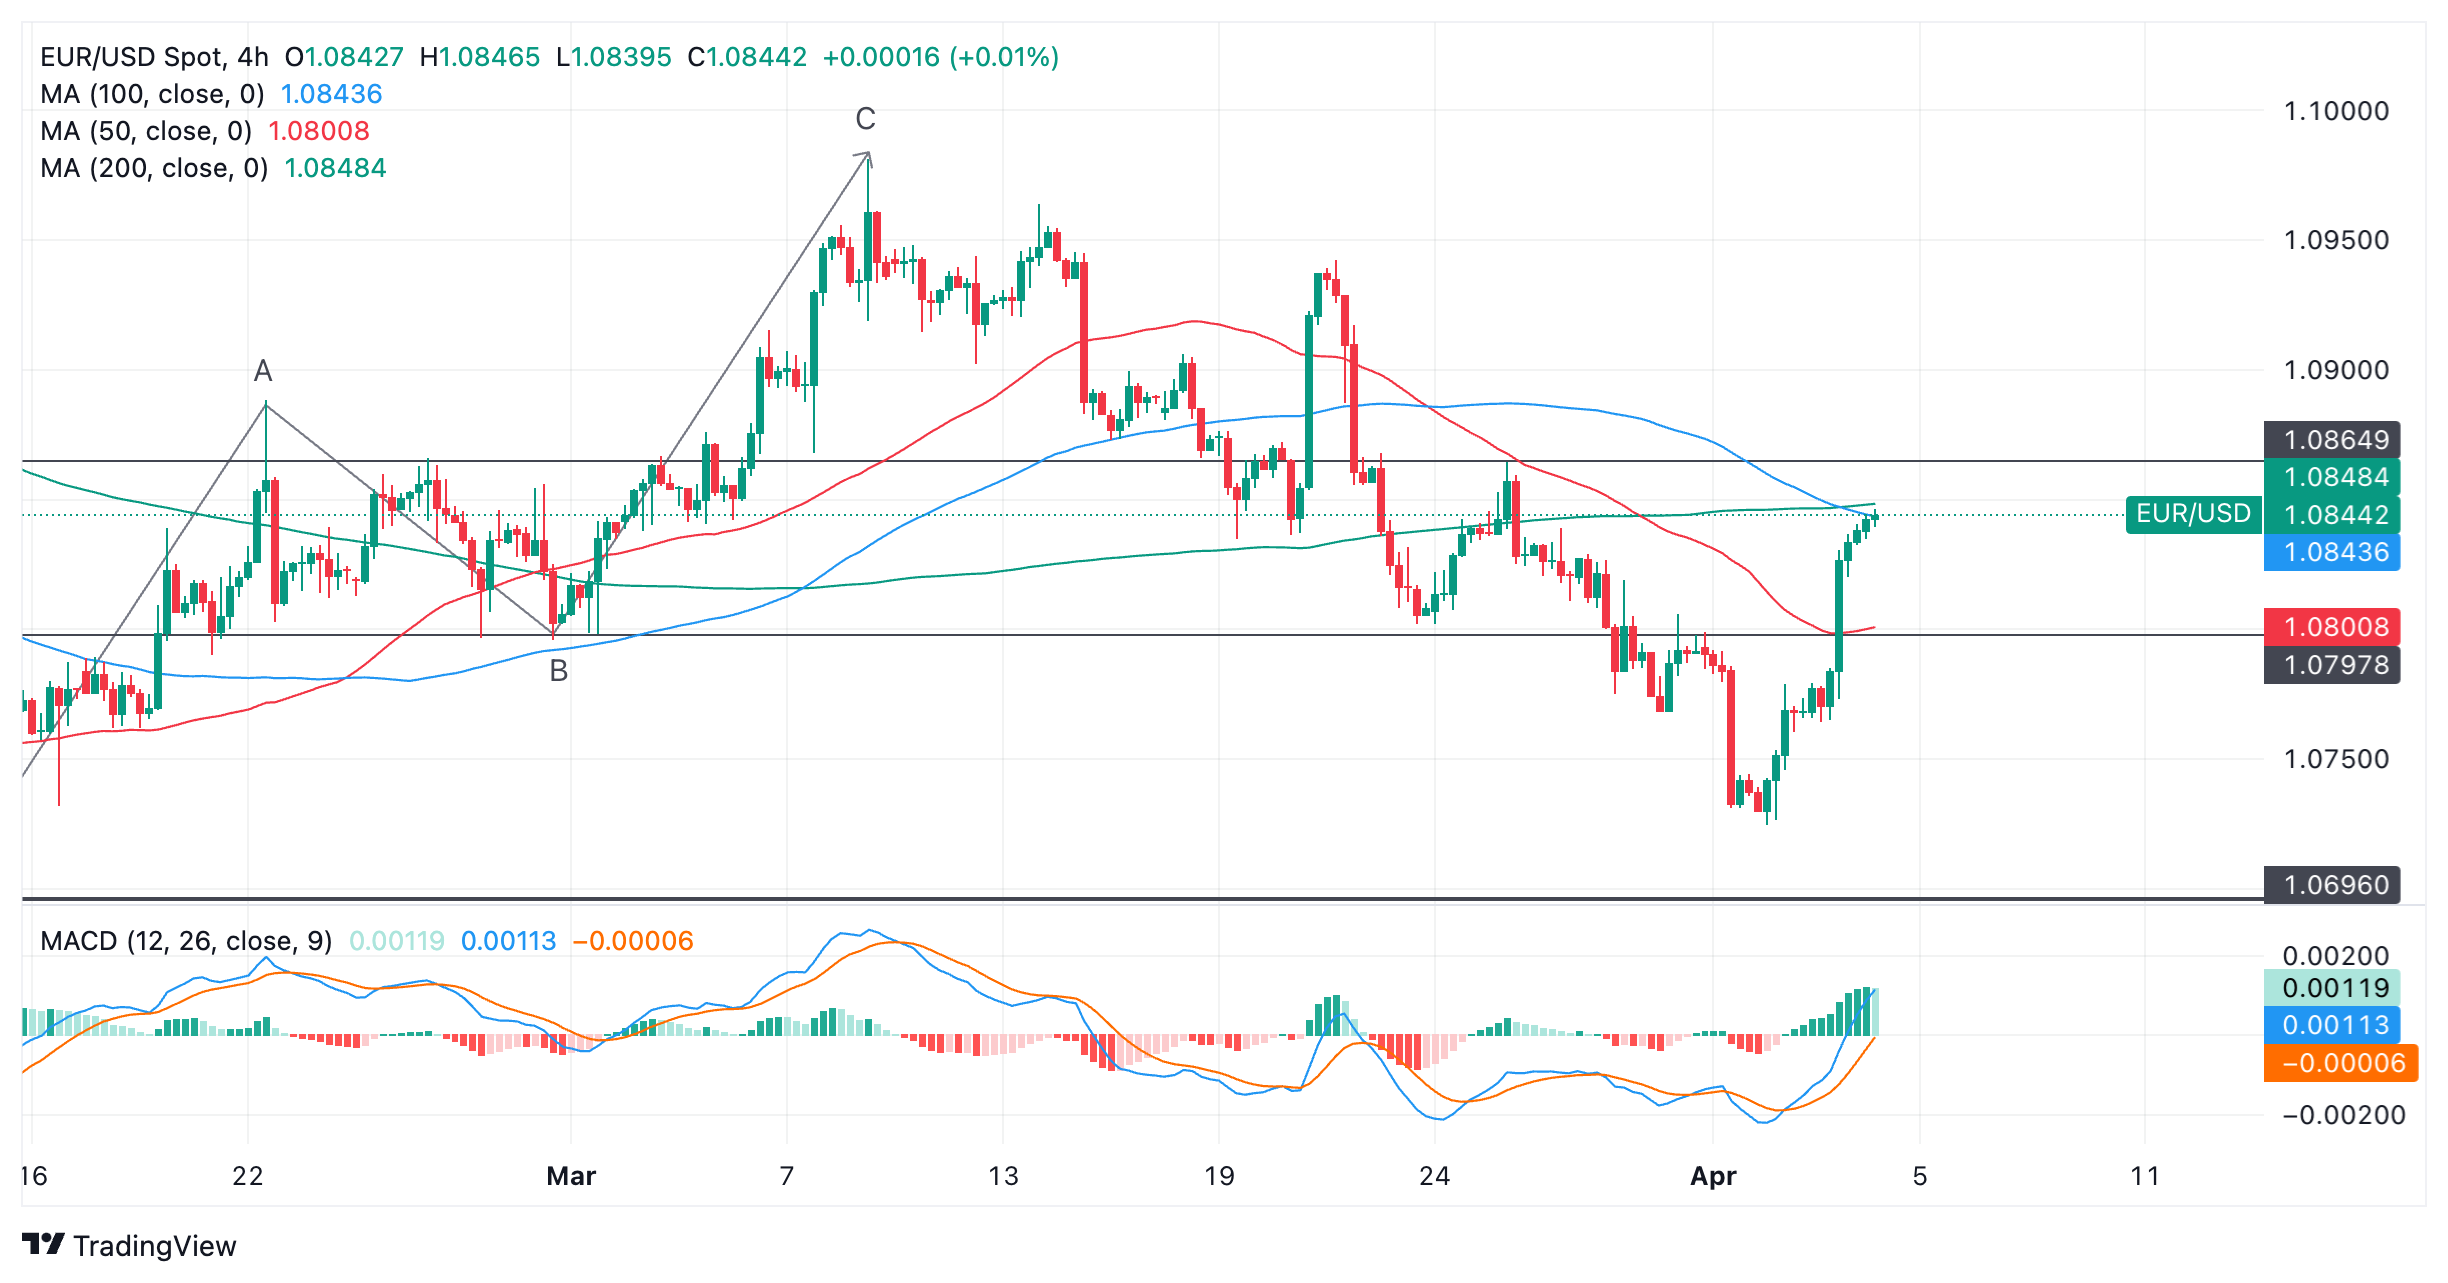
EUR/USD extends its recovery from short-term seven-week lows in the 1.0720s on Thursday.
It has now broken above a key resistance level from the swing low at the level of the B wave of the prior ABC pattern, suggesting the recovery is probably more than just a short pullback.
(Click on image to enlarge)
Euro versus US Dollar: 4-hour chart
The established short-term downtrend is in doubt as the peaks and troughs of price start trending higher on the 4-hour chart, which is primarily used to monitor that trend.
If price traces out one more higher low and higher high on the 4-hour timeframe, it will meet the criteria for a new uptrend, and switch the bias towards higher prices.
A break above the key March 26 peak would be a further bullish sign.
Should those criteria be met, the next upside target would be the 1.0940 high of March 21.
However, price is currently encountering substantial dynamic resistance from several major Moving Averages on different timeframes which may make further upside difficult.
As can be seen in the chart above, there are the 4-hour 100 and 200 Simple Moving Averages (SMA), as well as the 50-day and 200-day SMAs on the daily chart (not shown).
There is still, therefore, a risk of some weakness if bears manage to push price down from this confluence of SMAs.
The prior low at 1.0725 is the first downside target, followed by the 1.0694 February and year-to-date low.
More By This Author:
Gold Price Stands Tall Near Record High, Around $2,300 Amid Geopolitical RisksWTI Stands Tall Near Multi-Month Peak, Just Above $85.00/Barrel Mark
Mexican Peso Bucks The Trend, Ascends After Mixed U.S. Data, Stern Fed
Information on these pages contains forward-looking statements that involve risks and uncertainties. Markets and instruments profiled on this page are for informational purposes only and should not ...
more
-638478132076208757.png)


