
EUR/USD Range After Wave 3 Remains Bullish And Aims At 1.20
The EUR/USD made a bullish wave 3 (orange) as expected in our previous analysis. Now price action is moving sideways. What will the next price swing do?
This article reviews the key price and chart patterns. We also analyse the targets for both directions.
Price Charts and Technical Analysis
(Click on image to enlarge)
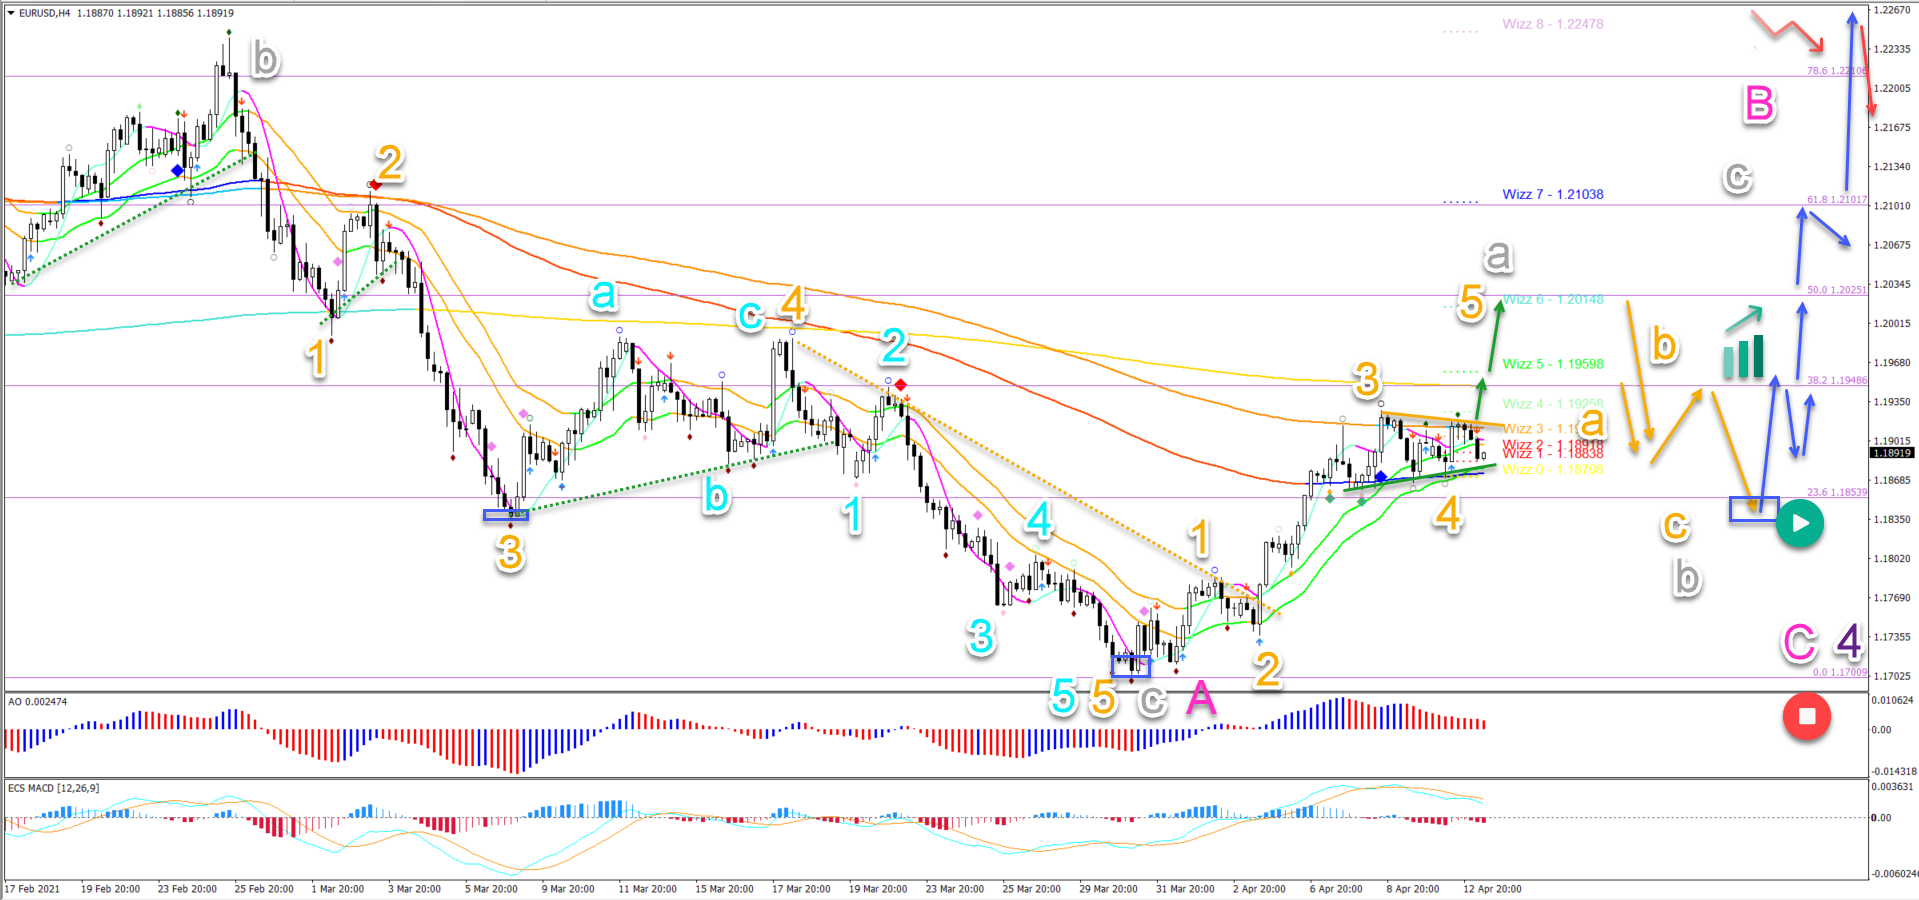
The EUR/USD is now going sideways, which means it’s building a range. The breakout of the range is key. But we expect a bullish breakout due to the strong bullish momentum (wave 3 orange):
- Price action seems to have completed a bearish ABC (grey) pattern in wave A (pink) at the recent low. With 5 waves (blue) in wave 5 (orange) finishing at 1.17 support.
- Then a strong rally confirmed the bullish reversal. Price action has remained above the 21 ema zone. The momentum indicates a wave 3 (orange).
- After that, the pullback has been mild. Price action has been respecting the 21 ema zone. This is typical for a wave 4 (orange).
- A breakout above the resistance (orange) could indicate a push higher towards the Fibonacci targets. The main target is at the 50% Fib around 1.20-1.2025.
- A bearish bounce at the 50% Fib could confirm the end of the wave A (grey) of wave B (pink).
- A bearish ABC pattern (orange) could indicate a wave B (grey).
- A bullish bounce back up is expected to start a 5 wave up within wave C (grey) of wave B (pink).
- Finally, a bearish reversal at the deep 88.6% Fib should send it lower for a wave C (pink) of wave 4 (purple).
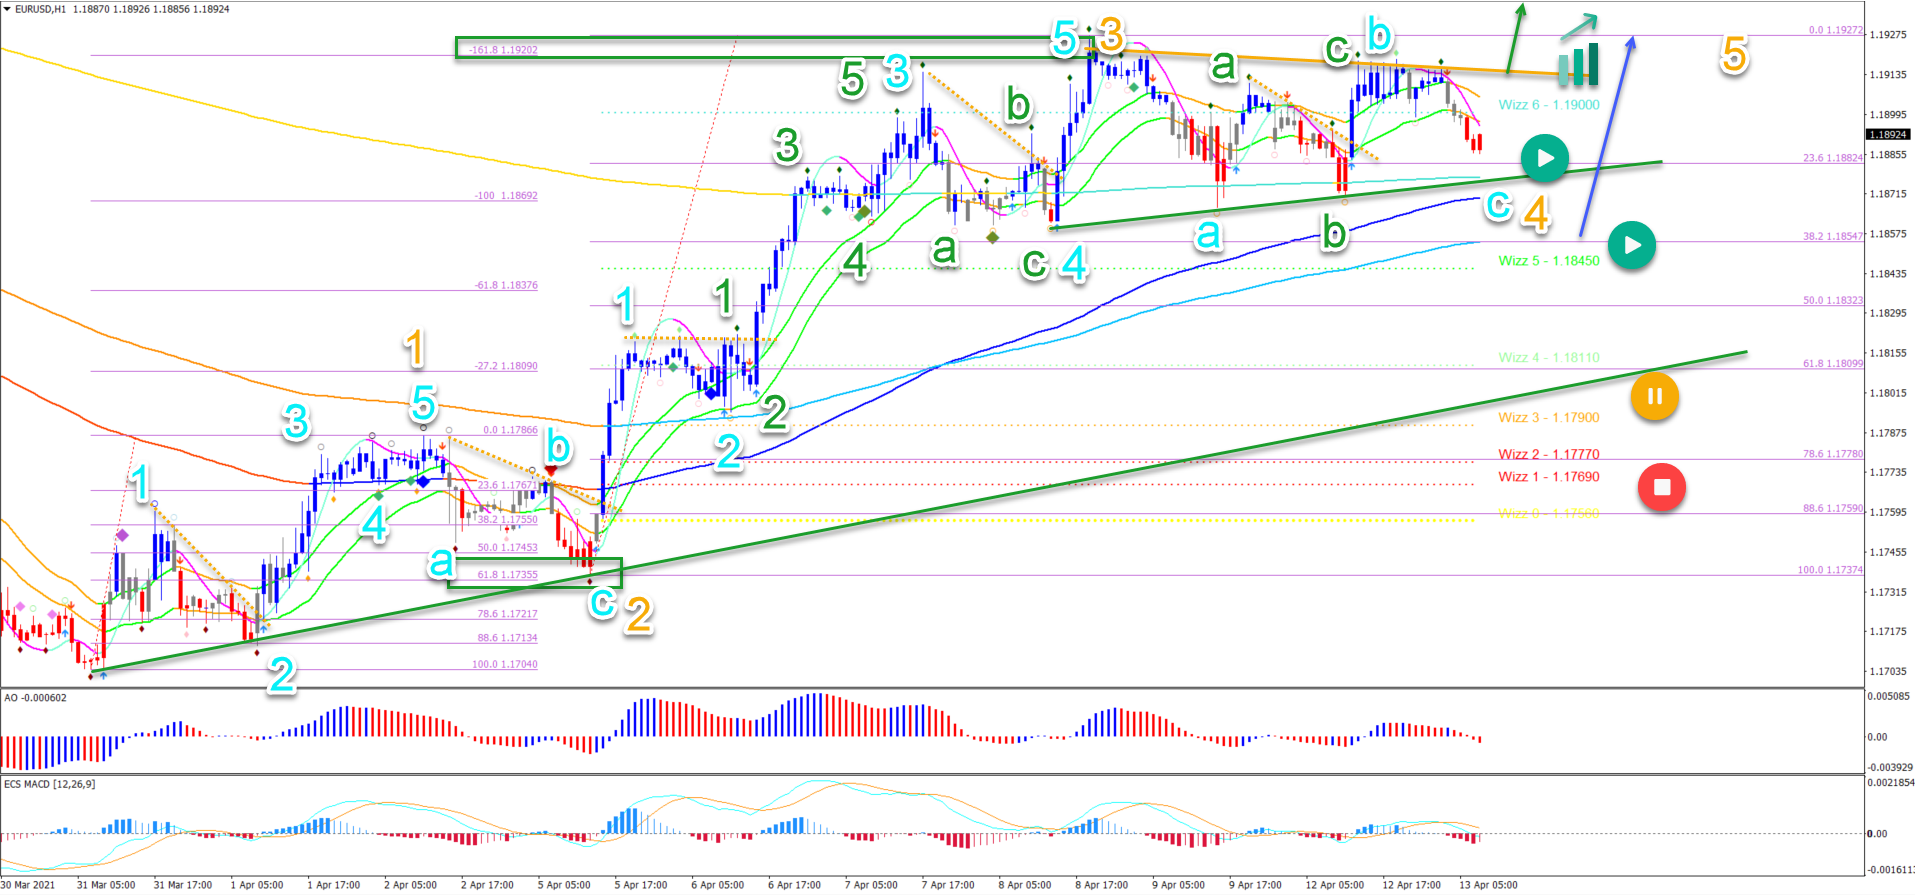
On the 1 hour chart, we can see that price action has reached the -161.8% Fibonacci target (green box) after bouncing at the 61.8% Fibonacci level (green box). There were also 5 waves (green) in 5 waves (blue), which completed wave 3 (orange):
- Now price action is building more ABC corrections. An ABC (green) in wave B (blue) and a larger ABC (blue).
- The corrections are mainly sideways, or in other words a range. This is typical for a wave 4 (orange).
- The wave 4 remains valid as long as price stays above the 50% Fib. A bounce at the 38.2% Fib (blue arrow) is typical for a wave 4.
- But a deeper retracement places this wave outlook on hold (orange circle) or invalidates it (red circle).
- A bullish breakout (green arrow) confirms the upside for wave 5 (orange).
(Click on image to enlarge)
Disclaimer: The opinions in this article are for informational and educational purposes only and should not be construed as a recommendation to buy or sell the stocks mentioned or to solicit ...
more

