
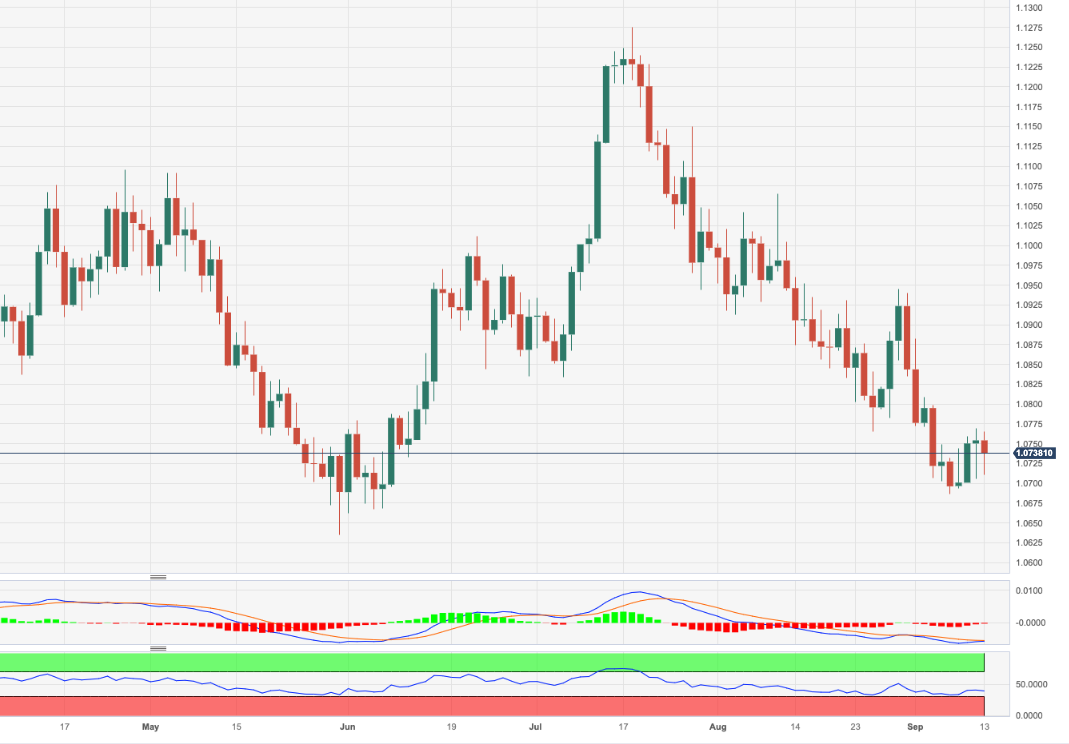
EUR/USD struggles to continue the weekly recovery and seems to have met a decent resistance around 1.0770 so far.
The underlying bearish sentiment remains unchanged and leaves the door open to extra pullbacks in the short-term horizon. Against that backdrop, the breach of the 1.0700 region could encourage sellers to embark on a probable visit to the September low of 1.0685 (September 7) ahead of the May low of 1.0635 (May 31).
In the meantime, further losses remain in the pipeline while below the key 200-day SMA, today at 1.0826.
EUR/USD daily chart
(Click on image to enlarge)
EUR/USD
| OVERVIEW | |
|---|---|
| Today last price | 1.0739 |
| Today Daily Change | 54 |
| Today Daily Change % | -0.14 |
| Today daily open | 1.0754 |
| TRENDS | |
|---|---|
| Daily SMA20 | 1.0811 |
| Daily SMA50 | 1.0944 |
| Daily SMA100 | 1.0905 |
| Daily SMA200 | 1.0826 |
| LEVELS | |
|---|---|
| Previous Daily High | 1.0769 |
| Previous Daily Low | 1.0705 |
| Previous Weekly High | 1.0809 |
| Previous Weekly Low | 1.0686 |
| Previous Monthly High | 1.1065 |
| Previous Monthly Low | 1.0766 |
| Daily Fibonacci 38.2% | 1.0745 |
| Daily Fibonacci 61.8% | 1.073 |
| Daily Pivot Point S1 | 1.0717 |
| Daily Pivot Point S2 | 1.0679 |
| Daily Pivot Point S3 | 1.0653 |
| Daily Pivot Point R1 | 1.078 |
| Daily Pivot Point R2 | 1.0806 |
| Daily Pivot Point R3 | 1.0844 |
More By This Author:
USD Index Price Analysis: Extra Gains Need To Surpass 105.15Natural Gas Futures: Further Rebound Seems Unlikely
EUR/JPY Price Analysis: Extra Range Bound Appears Likely


Comments
Log in or sign up to join the conversation.