
- DXY fades the earlier bull run to the boundaries of 105.00.
- Immediately to the upside emerges the monthly high at 105.15.
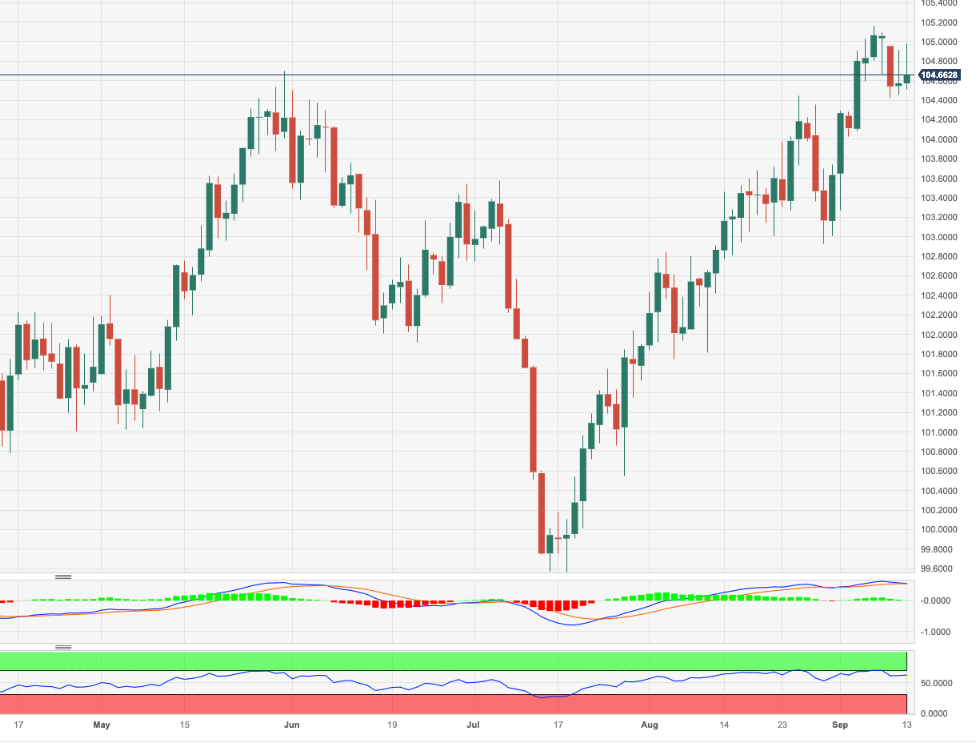
DXY gives away initial gains and now recedes to the 104.60 region on Wednesday.
The continuation of the multi-week rally appears well and sound and a breakout of 105.00 should encourages the index to retest the September top of 105.15 (September 7) prior to the 2023 peak of 105.88 (March 8).
While above the key 200-day SMA, today at 103.02, the outlook for the index is expected to remain constructive.
DXY daily chart
(Click on image to enlarge)
Dollar Index Spot
| OVERVIEW | |
|---|---|
| Today last price | 104.64 |
| Today Daily Change | 45 |
| Today Daily Change % | 0.07 |
| Today daily open | 104.57 |
| TRENDS | |
|---|---|
| Daily SMA20 | 104.02 |
| Daily SMA50 | 102.65 |
| Daily SMA100 | 102.75 |
| Daily SMA200 | 103.03 |
| LEVELS | |
|---|---|
| Previous Daily High | 104.92 |
| Previous Daily Low | 104.45 |
| Previous Weekly High | 105.16 |
| Previous Weekly Low | 104.02 |
| Previous Monthly High | 104.44 |
| Previous Monthly Low | 101.74 |
| Daily Fibonacci 38.2% | 104.74 |
| Daily Fibonacci 61.8% | 104.63 |
| Daily Pivot Point S1 | 104.38 |
| Daily Pivot Point S2 | 104.18 |
| Daily Pivot Point S3 | 103.91 |
| Daily Pivot Point R1 | 104.84 |
| Daily Pivot Point R2 | 105.11 |
| Daily Pivot Point R3 | 105.31 |
More By This Author:
Natural Gas Futures: Further Rebound Seems UnlikelyEUR/JPY Price Analysis: Extra Range Bound Appears Likely
Natural Gas Futures: A Corrective Decline Appears In Store


Comments
Log in or sign up to join the conversation.