
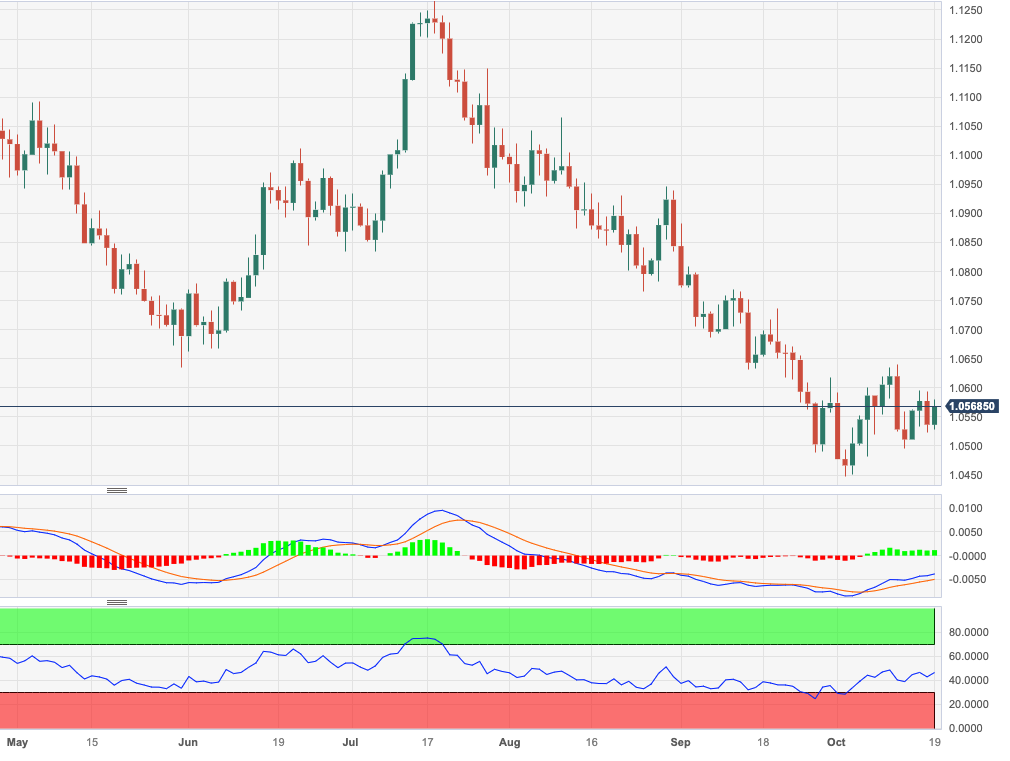
EUR/USD keeps the weekly choppiness well in place and now regains the 1.0570 region following Wednesday’s daily decline.
In case the recovery gathers a more serious pace, then the pair is expected to challenge the October high at 1.0639 (October 12) prior to a probable move to the transitory 55-day SMA at 1.0721.
Meanwhile, further losses remain on the table as long as the pair navigates the area below the key 200-day SMA at 1.0819.
EUR/USD daily chart
(Click on image to enlarge)
EUR/USD
| OVERVIEW | |
|---|---|
| Today last price | 1.0572 |
| Today Daily Change | 51 |
| Today Daily Change % | 0.33 |
| Today daily open | 1.0537 |
| TRENDS | |
|---|---|
| Daily SMA20 | 1.056 |
| Daily SMA50 | 1.0705 |
| Daily SMA100 | 1.0829 |
| Daily SMA200 | 1.0822 |
| LEVELS | |
|---|---|
| Previous Daily High | 1.0594 |
| Previous Daily Low | 1.0523 |
| Previous Weekly High | 1.064 |
| Previous Weekly Low | 1.0496 |
| Previous Monthly High | 1.0882 |
| Previous Monthly Low | 1.0488 |
| Daily Fibonacci 38.2% | 1.055 |
| Daily Fibonacci 61.8% | 1.0567 |
| Daily Pivot Point S1 | 1.0509 |
| Daily Pivot Point S2 | 1.048 |
| Daily Pivot Point S3 | 1.0438 |
| Daily Pivot Point R1 | 1.058 |
| Daily Pivot Point R2 | 1.0622 |
| Daily Pivot Point R3 | 1.065 |
More By This Author:
EUR/JPY Price Analysis: Further Side-Lined Trade In StoreNatural Gas Futures: Some Consolidation Should Not Be Ruled Out
Crude Oil Futures: Corrective Move Seems Likely Near Term


Comments
Log in or sign up to join the conversation.