
EUR/USD attempts to snap the losing streak that began on September 19, hovering around 1.0500 psychological level during the Asian session on Thursday. The pair is under pressure due to risk aversion, coupled with upbeat US Treasury yields and economic data.
On Wednesday, Germany’s downbeat Gfk Consumer Confidence Survey exerted pressure on the EUR/USD pair. The consumer sentiment revealed a decline of -26.5 in October from -25.6 prior.
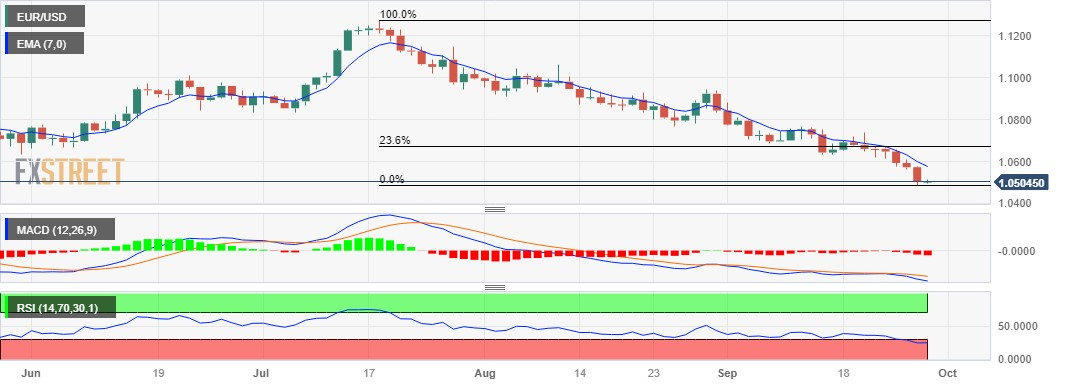
The current downward momentum in EUR/USD appears to have a potential bearish bias, given that the 14-day Relative Strength Index (RSI) remains below the 50 level. However, there is a support region around January’s low at 1.0481 that may pose a challenge for further losses.
If there's a breakthrough below the level, it could lead the EUR/USD bears to navigate the area around the psychological level at 1.0450.
On the upside, the EUR/USD pair may encounter significant resistance levels in its price movement. The seven-day Exponential Moving Average (EMA) at 1.0575 could act as a barrier, followed by the 1.0600 psychological level.
If the pair breaks above the latter, it may then explore the region around the 23.6% Fibonacci retracement at 1.0673.
The Moving Average Convergence Divergence (MACD) indicator is providing a bearish signal for the EUR/USD pair. The MACD line lies below the centerline and the signal line. This configuration suggests that there is potentially weak momentum in the price movement.
EUR/USD: Daily Chart
(Click on image to enlarge)
EUR/USD: ADDITIONAL IMPORTANT LEVEL
| OVERVIEW | |
|---|---|
| Today last price | 1.0509 |
| Today Daily Change | 0.0006 |
| Today Daily Change % | 0.06 |
| Today daily open | 1.0503 |
| TRENDS | |
|---|---|
| Daily SMA20 | 1.069 |
| Daily SMA50 | 1.0845 |
| Daily SMA100 | 1.0865 |
| Daily SMA200 | 1.0829 |
| LEVELS | |
|---|---|
| Previous Daily High | 1.0575 |
| Previous Daily Low | 1.0488 |
| Previous Weekly High | 1.0737 |
| Previous Weekly Low | 1.0615 |
| Previous Monthly High | 1.1065 |
| Previous Monthly Low | 1.0766 |
| Daily Fibonacci 38.2% | 1.0521 |
| Daily Fibonacci 61.8% | 1.0542 |
| Daily Pivot Point S1 | 1.0469 |
| Daily Pivot Point S2 | 1.0435 |
| Daily Pivot Point S3 | 1.0383 |
| Daily Pivot Point R1 | 1.0556 |
| Daily Pivot Point R2 | 1.0608 |
| Daily Pivot Point R3 | 1.0642 |
More By This Author:
GBP/USD Price Analysis: Remains Under Selling Pressure, The Key Contention Is Seen At 1.2100XAU/USD Remains Under Pressure Below $1,900 Amid Stronger USD, Eyes On US Data
USD/CAD Slipping Back Beneath 1.3500 As Surging Oil Prices Boost CAD


Comments
Log in or sign up to join the conversation.